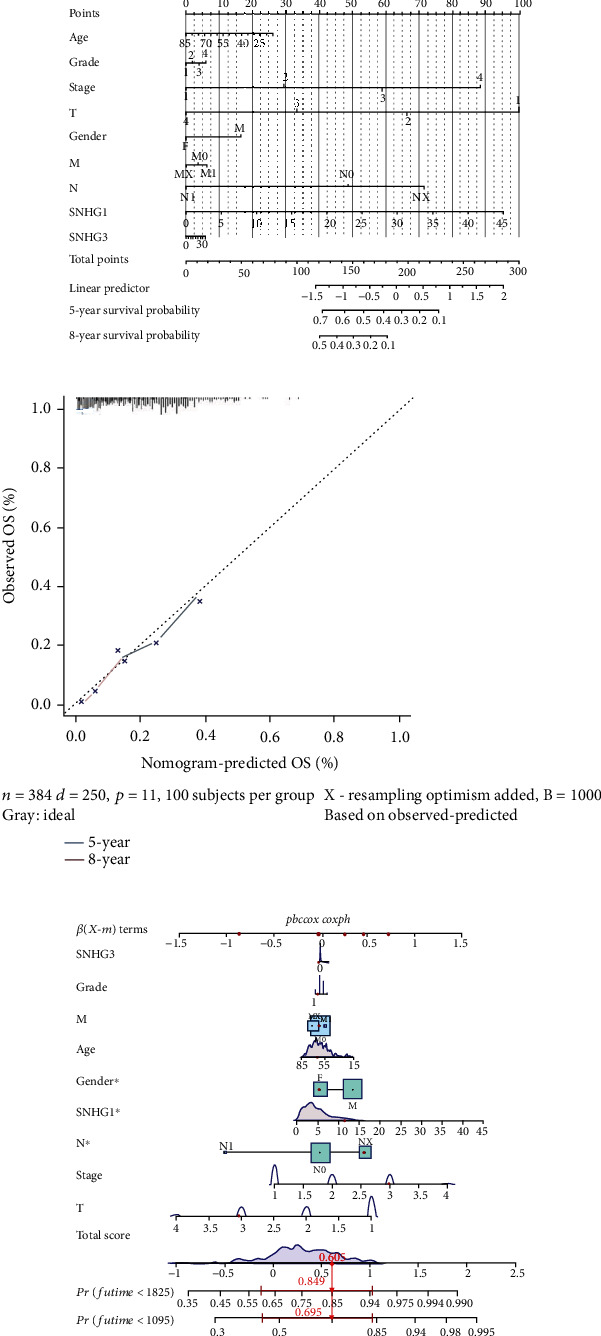
Figure 9.

Nomogram for the OS prediction of HCC patients. (a) The nomogram based on SNHG1 and SNHG3 combined with age, grade, stage, T, gender, M, and N to predict 5-year and 8-year OS of HCC patients. (b) The calibration curve for the predicted 5-year and 8-year OS of HCC patients according to the nomogram. The x-axis indicates the predicted OS, and the y-axis indicates the observed OS. (c) Construction of the Cox proportional-hazards model and SNHG1, SNHG3, grade, M, age, gender, N, stage, and T were included in the model.
