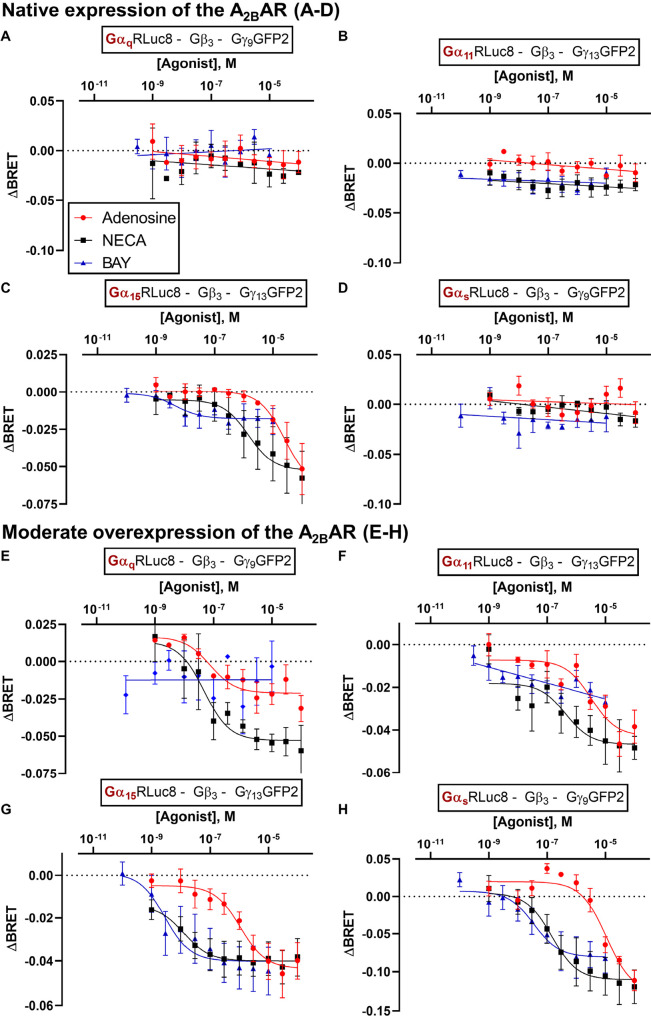
Figure 3.
Concentration–response curves of the agonists adenosine, NECA and BAY 60-6583 at HEK293 cells transiently transfected with TRUPATH biosensors for the indicated G protein subunits. A-D. ΔBRET values measured in HEK293 cells with native A2BAR expression levels and overexpression of the indicated biosensors A. Gαq, B. Gα11, C. Gα15, or D. Gαs-s. E-H. ΔBRET values measured in HEK293 cells with overexpression of the A2BAR and the indicated biosensors Gαq (e), Gα11 (f), Gα15 (g), or Gαs-s (h) biosensors. Data points are presented as means ± SEM of three or more independent experiments; pEC50 values and efficacy values are listed in Tables S2 and S3 of Supporting Information.

