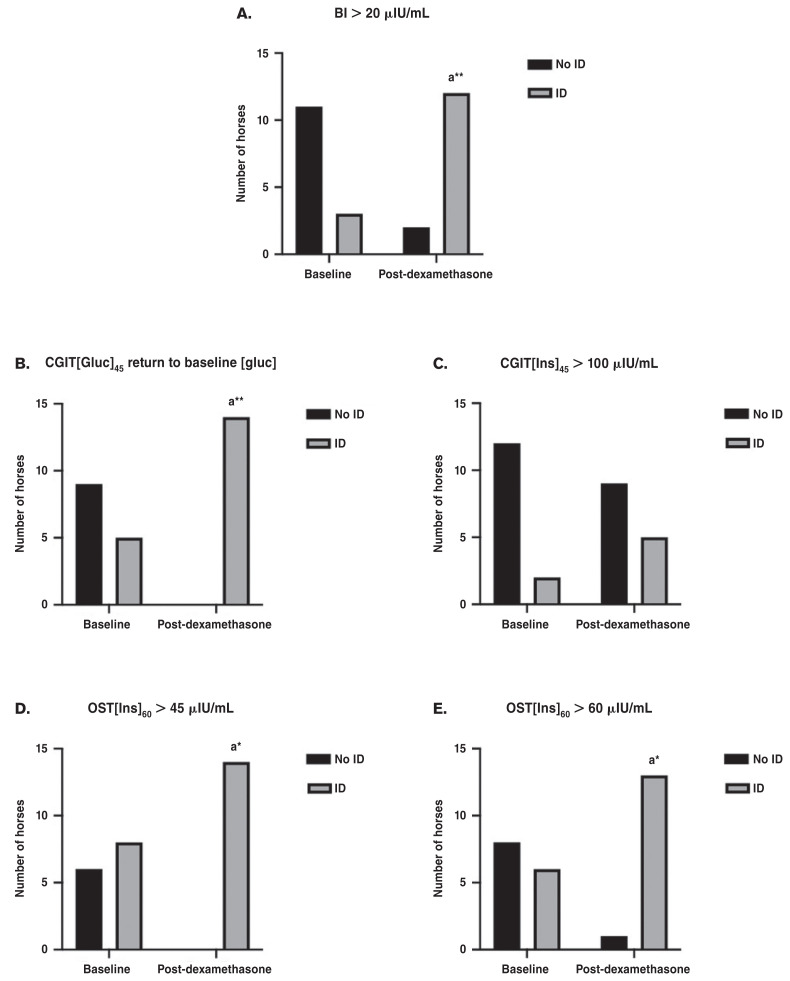
Figure 1.
Changes in categorical classification of insulin dysregulation following treatment with dexamethasone. Graph A demonstrates that significantly more horses were classified as insulin dysregulation using the basal insulin following dexamethasone treatment. Graph B demonstrates that significantly more horses were classified as insulin dysregulation using the criteria of CGIT[Gluc]45 returning to baseline blood [glucose]. Graph C demonstrates no statistical difference in the number of horses classified as insulin dysregulation based on the CGIT[Ins]45 > 100 μIU/mL. Graph D demonstrates that significantly more horses were diagnosed with insulin dysregulation based on the OST[Ins]60 > 45 μIU/mL. Graph E demonstrates that significantly more horses were diagnosed with insulin dysregulation based on OST[Ins]60 > 60 μIU/mL.
a Indicates significance from baseline time point; *P < 0.05.
AUCgluc0–240 — Area under the glucose curve from 0 to 240 min; AUCins0–150 — Area under the insulin curve from 0 to 150 min; [Ins]60 — Insulin concentration at 60 min; AUCgluc0–150 — Area under the glucose curve from 0 to 150 min; PP-Dgluc — Positive phase duration of the glucose curve; [Ins]45 — Insulin concentration at 45 min.

