
FIGURE 4.
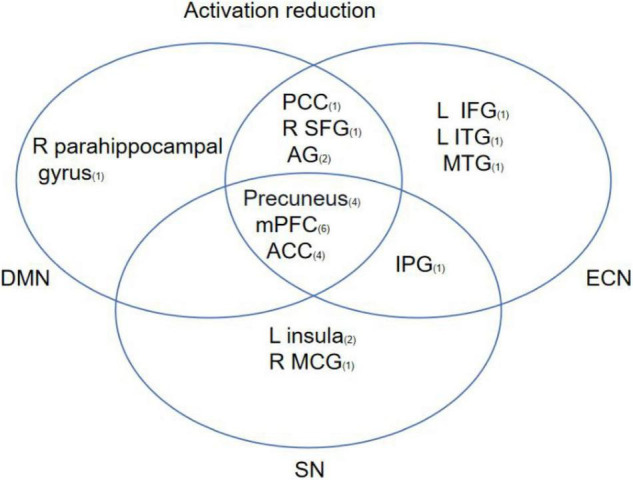
This figure shows regions that have been reported to show CBT-related changes and the overlap between regions involved in different brain networks. The subscript number next to the brain region represents the number of articles related to that brain region.