Fig. 3.
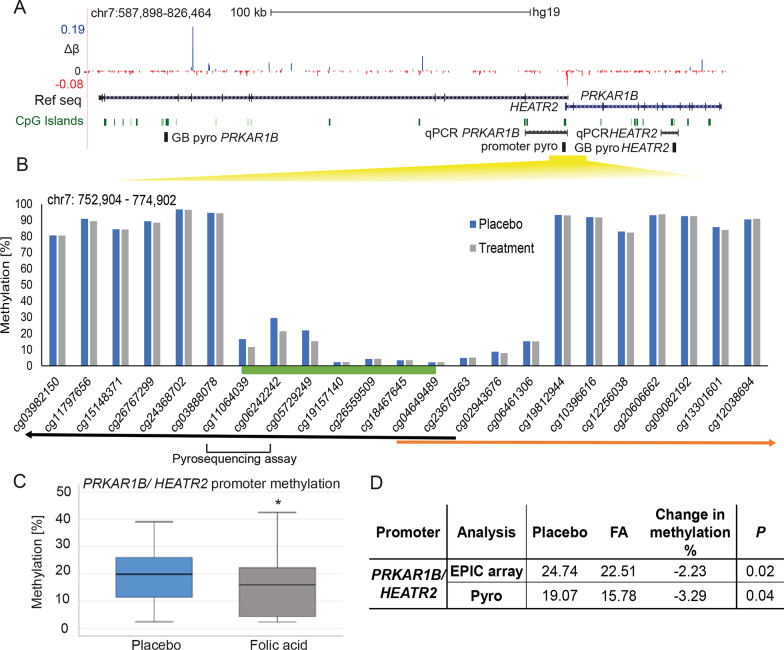
Methylation at the shared promoter for the PRKAR1B and HEATR2 genes. A UCSC Genome browser tracks showing the region around the differentially methylated promoter of the divergently transcribed genes PRKAR1B and HEATR2, with genomic coordinates in hg19 human genome release, and scale as shown. EPIC array probes showing differential methylation (blue, gain; red, loss) are indicated, with size indicating the magnitude of change. The position of the pyrosequencing assay of promoter and GB (Pyro promoter/pyro GB) and RT-qPCR are also shown (black). Δβ, mean difference in β value between placebo and FA-treated groups; maximum gain and loss also shown (+ 0.19β = 19%, − 0.08β = 8% methylation). The position of the CGI within the region is highlighted (green lines). Both genes are transcribed from one promoter located within CGI (yellow bar). B Low promoter methylation overlapping CGI is accompanied by high GB methylation of PRKAR1B and HEATR2. Genome-wide methylation analysis of CB samples confirmed low levels of methylation at the promoter CGI (green bar) and high levels throughout the genes of both placebo (blue) and FA supplemented participants (grey). The location of indicative CGs assayed is shown as well as the direction of transcription from promoter CGI (green bar) of PRKAR1B (black arrow) and HEATR2 (orange arrow). C FA supplementation affects the methylation of the shared promoter. Boxplot showing difference in methylation from pyroassay covering promoter shown in Table 1/Fig. 3A. D Average methylation at the promoter of PRKAR1B/HEATR2 genes by pyrosequencing in the placebo and FA CB samples compared to EPIC 850 k array; P probability by Student’s t test

