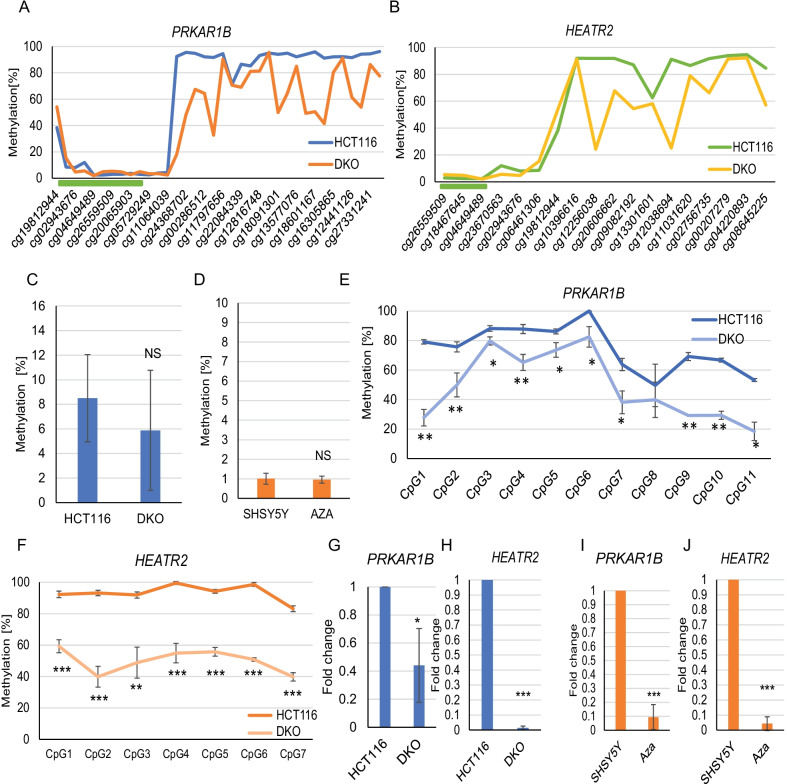
Fig. 4.
Gene body methylation drives expression of PRKAR1B/HEATR2. A Methylation levels at individual CG sites covered by the Illumina 450 K array in WT (HCT116, blue) and knockout (DKO, orange) cells within PRKAR1B gene with highlighted CGI within promoter (green bar). B Data as in A for the HEATR2 gene . C DNA methylation differences at PRKAR1B/HEATR2 promoter assessed by pyroassay in WT (HCT116) and DKO cells (blue) and D SHSY5Y WT and Aza (orange) -treated cells. E DNA methylation levels at CG sites located within GB of PRKAR1B and F HEATR2 covered by pyroassay in WT (HCT116) and knockout (DKO cells). Values are shown as mean +/− SD for each site: *p < 0.05; **p < 0.01; ***p < 0.001. RT-qPCR of PRKAR1B (G) and HEATR2 (H) in HCT116 and SHSY5Y (I, J) cell lines. Location of pyroassays and RT-qPCR products used for this figure are indicated in Fig. 3A. Values are shown as mean +/− SD: *p < 0.05; **p < 0.01; ***p < 0.001

