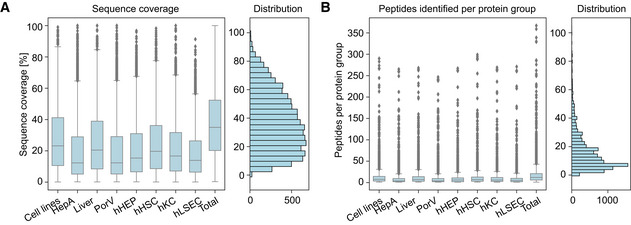
Box plots of sequence coverage distribution of all proteins quantified in each tissue/cell type, and in all samples combined (hHSC: hepatic stellate cell, hHEP: hepatocyte, hKC: Kupffer cell, hLSEC: liver sinusoidal endothelial cell, liver: bulk liver biopsy, HepA: hepatic artery, PorV: portal vein, Cell lines: mixture of human liver‐derived immortalized cell lines). Number of independent biological replicates is n = 4 for cell lines; n = 6 for HepA, Liver and PorV; and n = 3 for hHEP, hHSC, hKC and hLSEC. The gray line in the middle of the box is the median, the top and the bottom of the box represent the upper and lower quartile values of the data and the whiskers represent the upper and lower limits for considering outliers (Q3+1.5*IQR, Q1−1.5*IQR) where IQR is the interquartile range (Q3–Q1).

