
Figure EV2. Cellular mass composition based on protein classes.
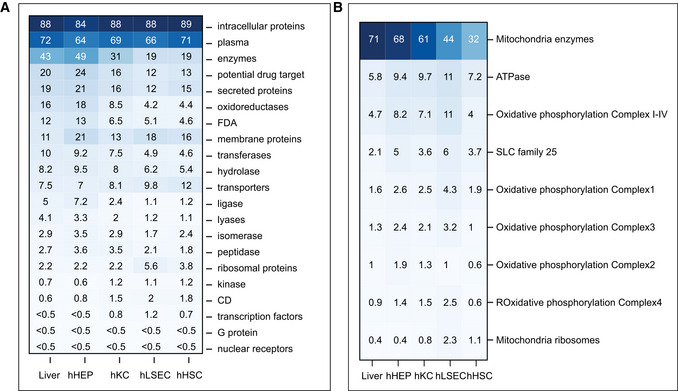
- Percent protein mass by protein classes. Protein class annotation was based on the HPA classification.
- Percent protein mass in the mitochondria by selected protein classes. Oxidative phosphorylation is the sum of Complex 1–4.