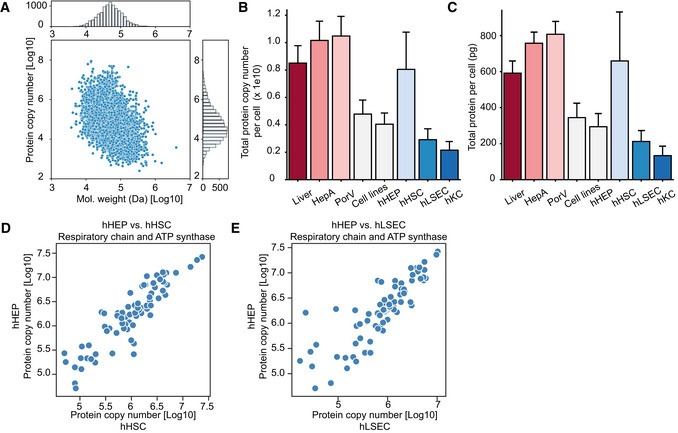
Figure EV3. Protein copy number estimation.

-
AAveraged protein copy number versus molecular weight in the hepatocyte proteome, with histogram on the x‐ and y‐axis representing distribution of the molecular weights and protein copy numbers, respectively. Averaged protein copy numbers are derived from n = 3 independent biological samples.
-
B, CTotal protein copy number (B) and total protein mass per cell (C) in liver tissues and cell types estimated by the “proteome ruler” approach. Number of biological replicates is n = 6 for Liver, HepA, PorV; n = 4 for Cell lines and n = 3 for hHEP, hHSC, hLSEC and hKC. Values are presented as mean ± s.d.
-
D, EProtein copy number for members of the oxidative phosphorylation complex I–V in hepatocytes and hepatic stellate cells (D), sinusoidal endothelial cells (E).
