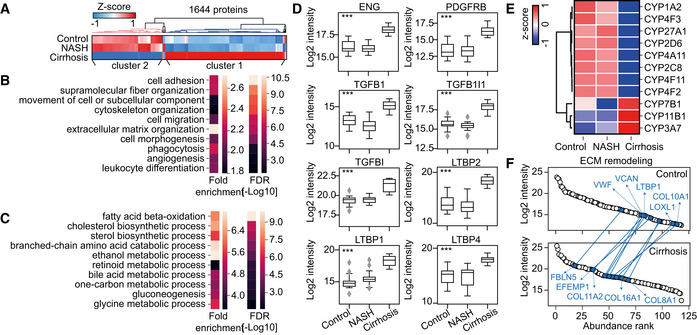
Hierarchical clustering of proteins significantly differentially abundant between NASH (n = 20), cirrhosis (n = 10) and control groups (n = 15). Significance was calculated by ANCOVA, followed by Benjamini–Hochberg correction for multiple hypothesis testing (FDR < 0.05). Two major clusters of proteins were identified with Cluster 1 mainly upregulated in cirrhosis compared to NASH and controls and Cluster 2 downregulated. No additional replications of the experiment was done in laboratory.
Ten representative highly enriched GOBP terms in proteins in Cluster 1 of Panel (A). Significance was calculated by Fisher’s exact test corrected for multiple hypothesis testing with FDR < 0.05.
Ten representative highly enriched GOBP terms in proteins in Cluster 2 of Panel (A). Significance was calculated by Fisher’s exact test corrected for multiple hypothesis testing with FDR < 0.05.
Box‐and‐whisker plot showing the distribution of log2‐intensity values of statistical significantly regulated proteins across three groups. Number of independent biological replicates is n = 15, 20 and 10 for the control, NASH and cirrhosis group, respectively. The black line in the middle of the box is the median, the top and the bottom of the box represent the upper and lower quartile values of the data and the whiskers represent the upper and lower limits for considering outliers (Q3+1.5*IQR, Q1−1.5*IQR) where IQR is the interquartile range (Q3–Q1). Significance was defined by ANCOVA followed by Benjamini–Hochberg correction for multiple hypothesis testing (FDR < 0.05) with a significance level of ***P < 0.001.
Heatmap of CYP 450 family members that are statistically significantly abundant between three groups. Data were presented as mean protein abundance followed by Z‐score normalization across the three experimental groups. Number of replicates is same as Panel (C).
Extracellular matrix (ECM) remodeling in liver cirrhosis. Upper and lower panel shows the abundance rank of proteins involved in ECM organization in the control (upper) and cirrhosis (lower) groups, highlighting top shifted ECM components in the cirrhosis group as compared with the control group.

