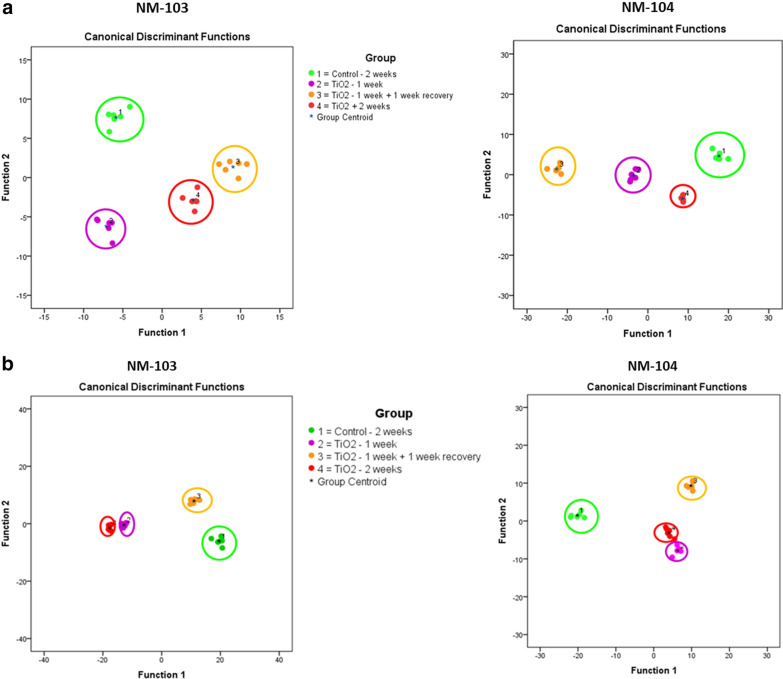
Fig. 7.
TOF–SIMS analysis of changes in compound composition of the cell membrane of Caco-2 (A) and HepaRG (B) cells after treatment with TiO2 nanoparticles at a concentration of 3.13 µg/cm2 for 1 week, 2 weeks and for 1 week with a 1-week recovery period. The diagram shows the values of the discriminant scores obtained from Fisher's discriminant analysis of 24 Caco-2 and HepaRG cell samples. The performance of the discriminant model was verified by applying the cross-validation procedure based on the “leave-one-out” cross-validation formalism (100%)

