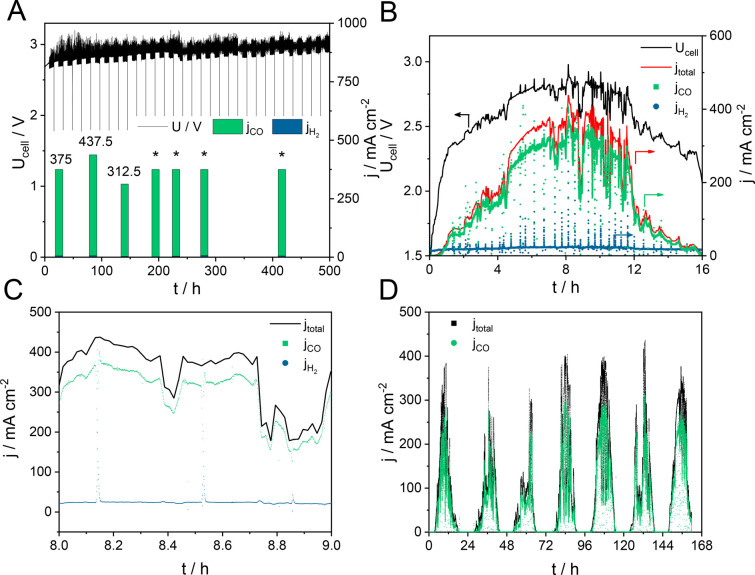
Figure 1.
(A) Cell voltage and product distribution during electrolysis according to the current protocol shown in Figure S4. The asterisks mark partial current density values obtained at j = 375 mA cm–2 total current density, while the analysis at 90 and 140 h was performed at 437.5 and 312.5 mA cm–2, respectively. Cell voltage and (partial) current density during electrolysis at a continuously changing current density, following the power profile of a solar PV plant (B–D) for different time periods.

