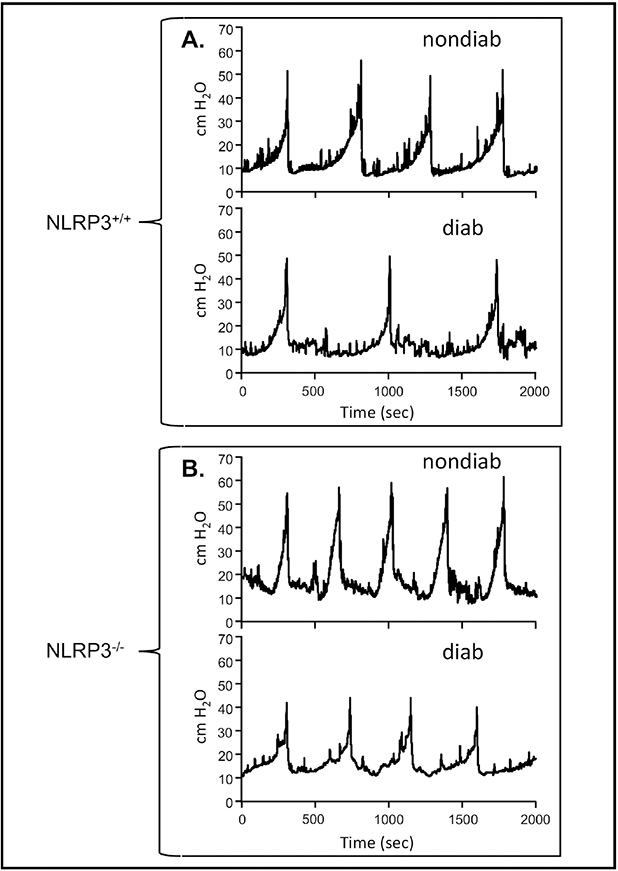
Figure 4. NLRP3 is responsible for bladder dysfunction associated with DBD: Representative tracings of intravesicular pressures over time.
Each panel is a single representative tracing (or part of a tracing) of the luminal pressure (cm H2O) in the bladder and how it changes over several micturition cycles. These tracings were obtained during cystometry for each of the four experimental groups reported in the Methods section and recorded using an in-line pressure transducer. The tracings were chosen to represent only several micturition cycles (more may have occurred) and aligned so the peak of the first cycle aligns for each tracing to allow easy visual determination of the time between voids which is used to calculate urinary frequency. Typically, three to eight micturition cycles were quantitated per animal. Tracings from the scale used to measure voiding volume is not shown but voids align with the peaks in pressure A. Representative tracing from the NLRP3+/+ strains. B. Representative tracings from the NLRP3−/− strains. non-diab = nondiabetic. diab = diabetic.

