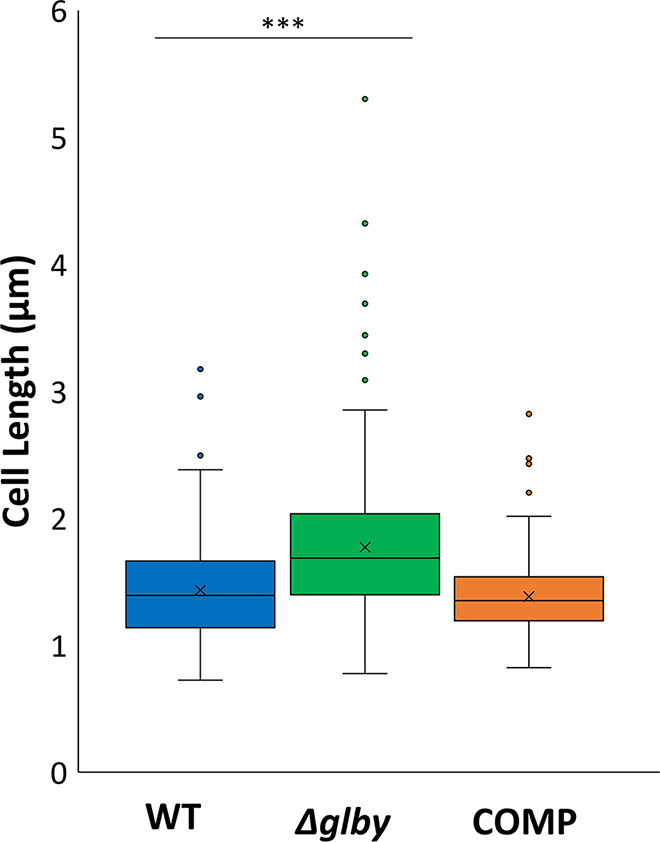
FIG 3.

Box plots of cell lengths by strain. Box represents the interquartile range (middle 50% of the data). Vertical lines coming out of each box represent the minimum and maximum of the data. Dots represent outliers, horizontal line in the box represents the median cell length and “x” within the box represents the mean cell length of each strain. Cell lengths were determined by SEM and measured using ImageJ. Parent strain Mab ATCC 19977 (WT), Δglby, and Complemented strain (COMP).
