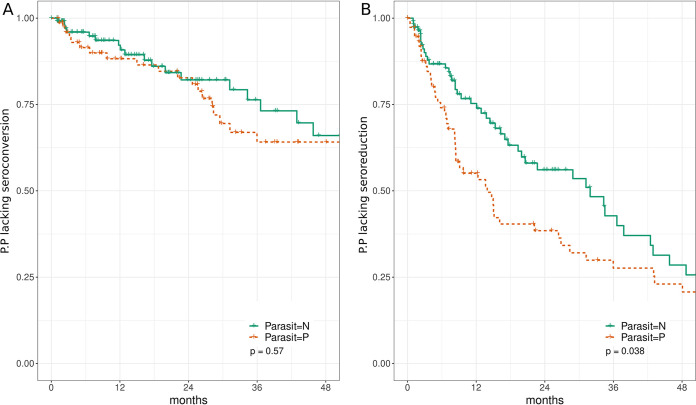
FIG 3.
Kaplan-Meier curves of seroconversion (A) and seroreduction (B) stratified by parasitological results at baseline. Ordinates depict the proportion of patients (P.P.) lacking seroconversion (A) or seroreduction (B). Only patients with positive serology at baseline and a performed parasitological test were included in the analysis. Patients in the infant group (0 to 8 months) were excluded from this analysis in order to avoid a bias caused by the diagnosis criteria (see main text). Patients presenting a negative parasitological result at baseline (n = 130) were plotted in green (Parasit = N) and patients presenting a positive parasitological result (n = 76) at baseline were plotted in red (Parasit = P).

