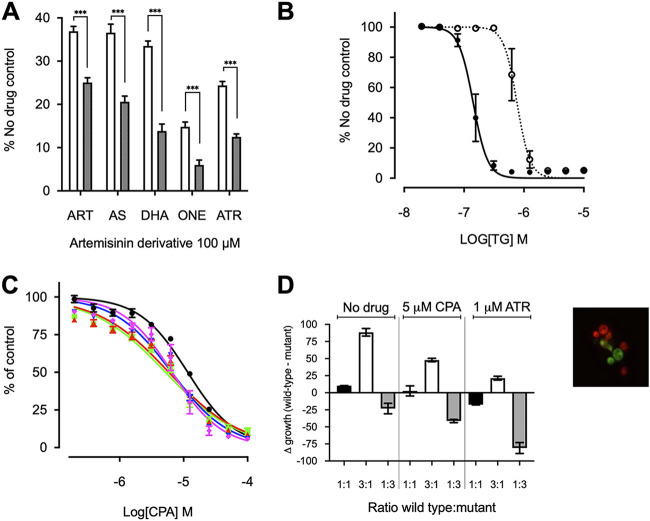
FIG 4.
Effect of single-nucleotide polymorphisms on artemisinin sensitivity. (A) K667Δpdr5[SERCA1a]E255 (white) and K667Δpdr5[SERCA1a]255L (black) were treated with 100 μM artemisinin (ART), artesunate (AS), DHA, artemisone (ONE), and artemether (ATR). ***, P < 0.0001. (B) Dose-response curves with thapsigargin (TG) for K667Δpdr5[SERCA1a]255L (dotted line) and K667Δpdr5[SERCA1a]E255 (solid line). Note that the IC50 for K667Δpdr5[SERCA1a]E255 is the same as that in Fig. 1D, because the assays were performed together. (C) Dose-response curves with CPA for wild-type K667[PfATP6] (black circles) versus strains expressing PfATP6 with resistance-conferring single-nucleotide polymorphisms S769N (blue triangle), L263E (green square), A623E (red triangle), and A623E/S769N (magenta diamond). (D) Fitness cost of K667Δpdr5[mCherry][PfATP6]769N, compared to the wild-type K667Δpdr5[Venus][PfATP6]S769, with and without drug pressure from 1 μM artemether (ATR) or 5 μM CPA. The extracellular calcium concentration was 50 mM. Fitness cost is presented as the change in growth between the wild-type and mutant strains after coincubation. Differences in growth (Δgrowth) (in percent) were calculated as the relative fluorescence of each strain when grown together at different starting ratios of wild-type strain/mutant strain, i.e., 1:1 (black), 3:1 (white), or 1:3 (gray). Means are of 2 biological replicates and 5 technical replicates. P values from Student’s t test comparing each ratio with and without drug were all <0.05.

