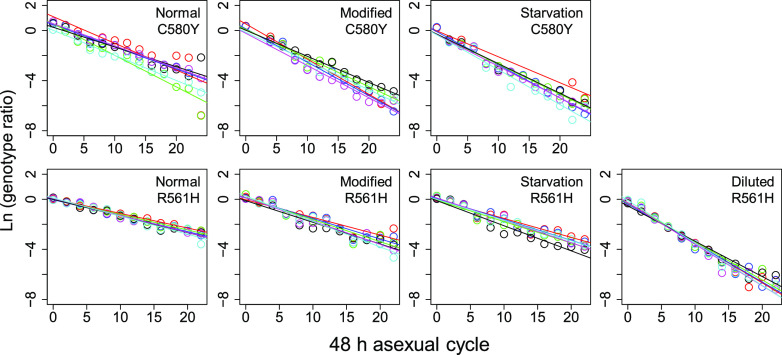
FIG 2.
Trajectory of competing parasites observed in replicate experiments. The plots show the natural log of the parasite ratio against time between competing parasites. The results shown are for the ART-R mutant (C580Y or R561H) compared to the isogenic ART-S clones (C580C or R561R) for each variant amino acid. The slope for the least-squares fit provides an estimate of the selection coefficient (s). Each color represents one replicate.

