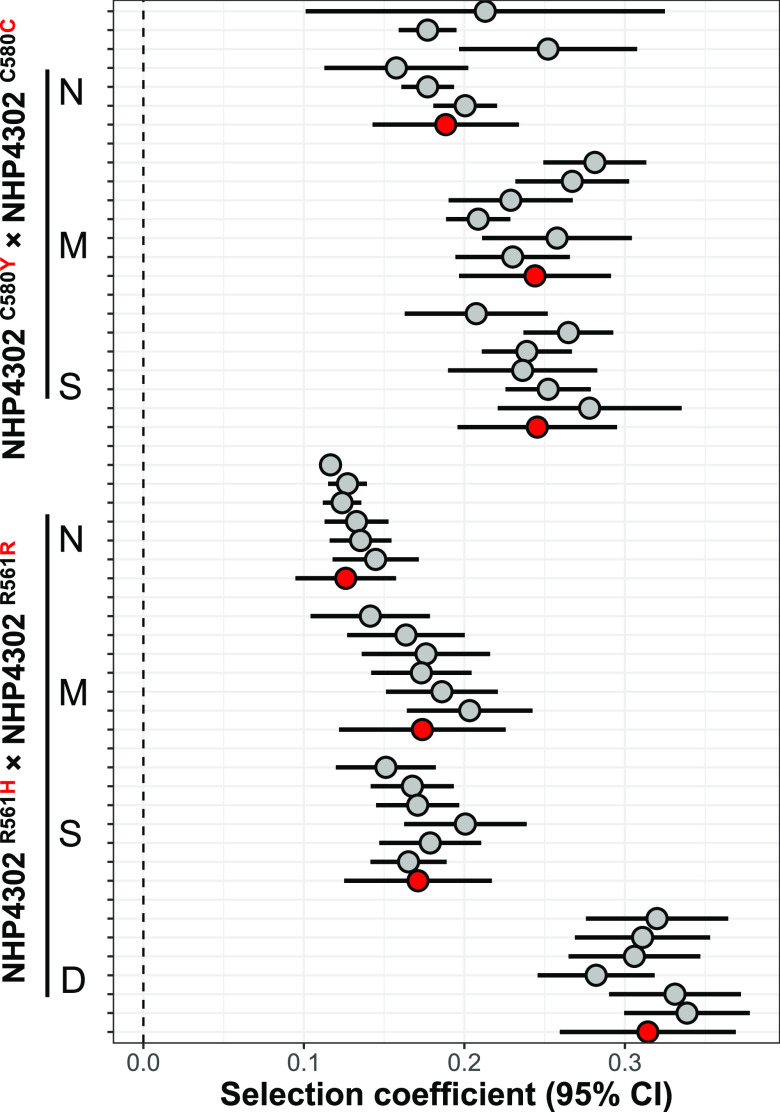
FIG 3.
Outcome of competition experiments in different media. The plot shows selection coefficients (s) with 95% confidence intervals for competition experiments conducted in different media. Six replicate competition experiments were conducted for each set. Grey points shows selection coefficients for each replicate, while the red points show meta-analysis results for each experimental comparison. The “winning” parasites (NHP4302C580C or NHP4302R561R) are shown on the right for each comparison.

