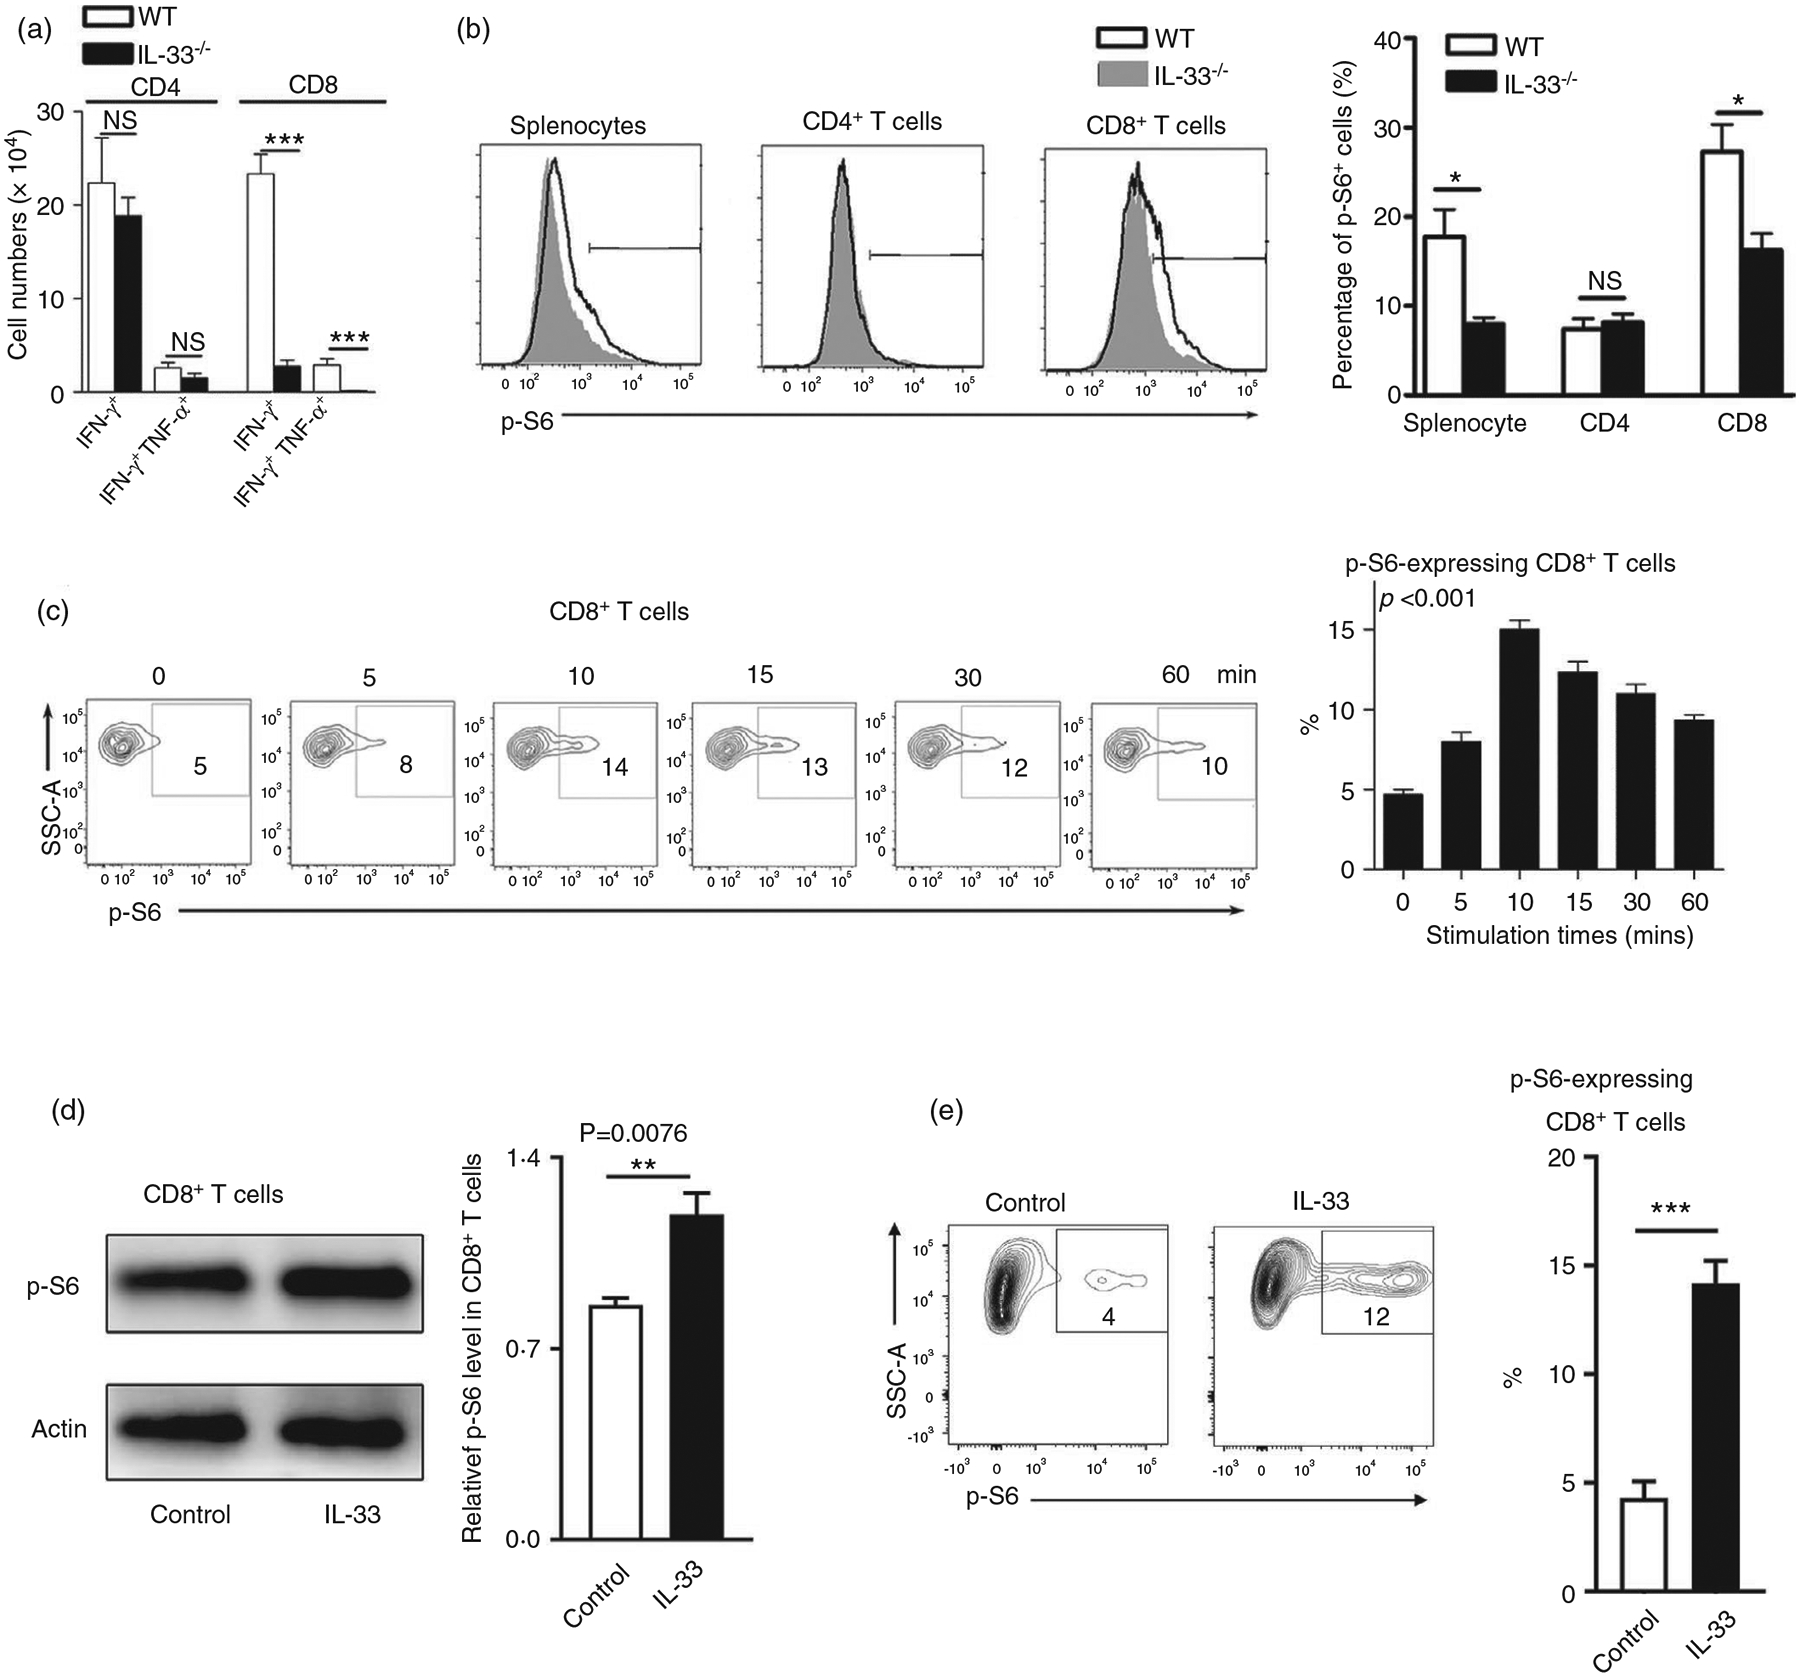
FIGURE 2.

Increased p-S6 expression in CD8+ T cells by IL-33 stimulation. (a) WT and IL-33−/− mice were infected with LCMV (2 × 10⁶ FFU/mouse) and killed at 7 days post-infection. Lymphocytes were prepared from spleens and stimulated with viral peptides GP33 and GP61 in the presence of Brefeldin A for 5 h, followed by surface marker and intracellular cytokine staining. The numbers of IFN-γ+ and IFN-γ+ TNF+ T cells were calculated. (b) Splenocytes isolated from infected mice were fixed and permeabilized for p-S6 staining. The percentages of p-S6+ cells were shown. (c) Splenocytes isolated from naïve mice were cultured in anti-CD3/CD28-coated plates for 3 days. Cells were harvested, rested in RPMI 1640 medium without FBS for 1 h, and incubated with 100 ng/ml IL-33 at 37°C for the indicated times. The p-S6 expression was evaluated according to the BD Phosflow staining protocol, and the percentages of p-S6+ cells are shown. (d) CD8 T cells were purified from WT mouse spleens, followed by the culture in anti-CD3/CD28-coated plates for 3 days. Cells were rested in RPMI 1640 medium without FBS for 1 h, followed by IL-33 treatment (100 ng/ml) at 37°C for the 20 min. Cell protein was extracted using a RIPA buffer with the phosphatase inhibitor cocktail, and the p-S6 expression was evaluated by Western blot. (e) CD8+ T cells were isolated from the spleen of IL-33−/− mice and cultured as in (d). The percentages of p-S6+ cells are shown. The data are shown as mean ± SEM of n = 3–5 mice/group from single experiments and are representative of at least three experiments performed. For in vitro experiments, triplicates were performed for each group. A two-tailed Student’s t test was used for statistical analysis of two groups. One-way ANOVA was used to compare three or more groups. *p < 0·05; ***p < 0·001; NS, no significant difference
