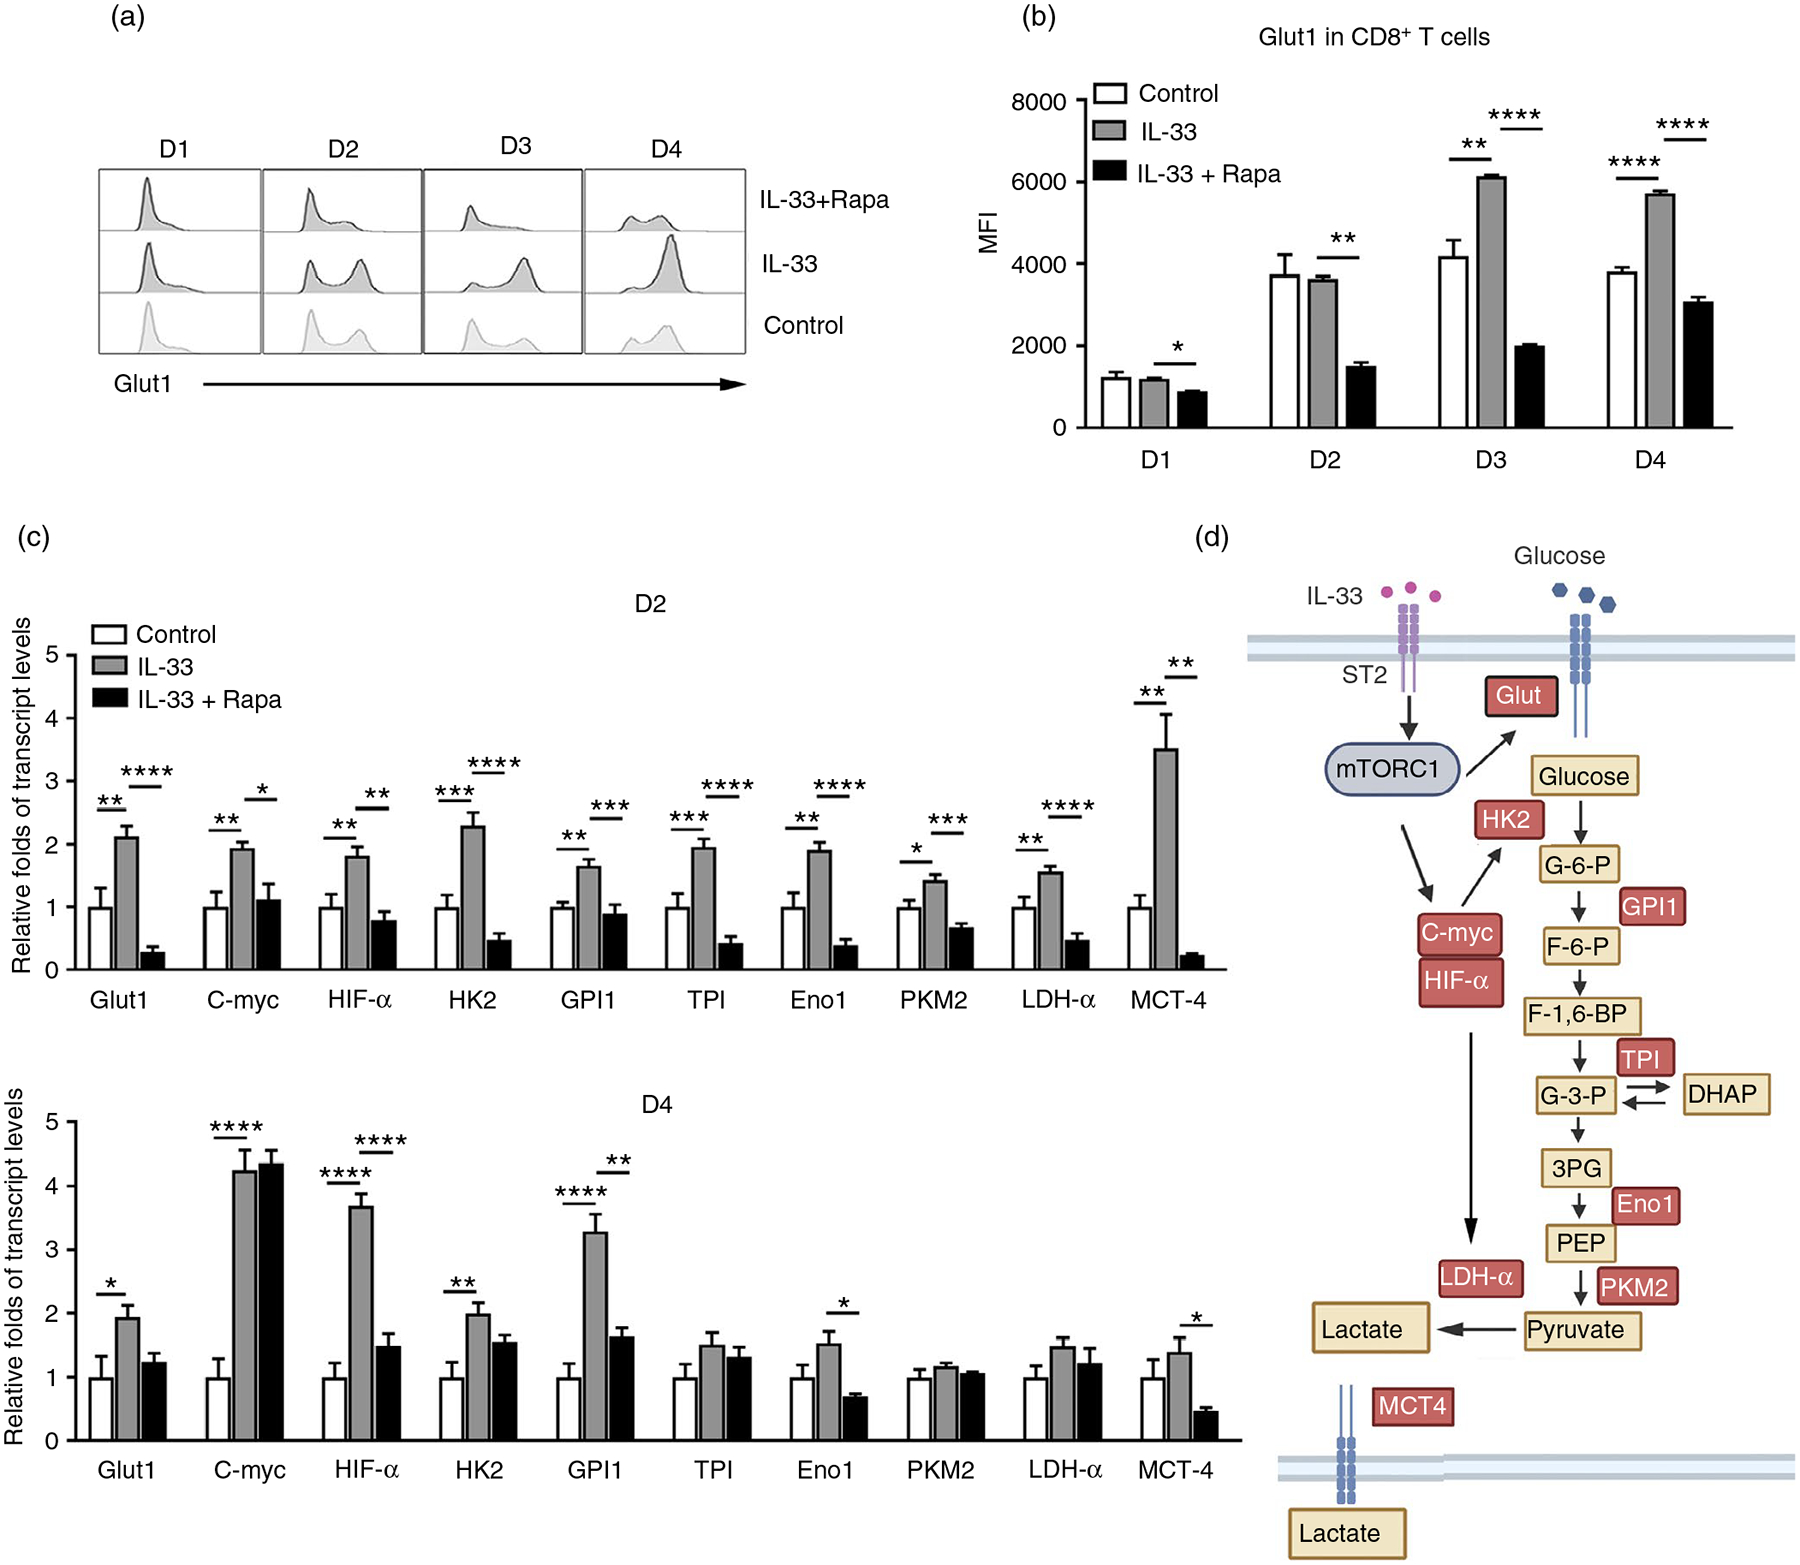
FIGURE 5.

IL-33 modulates glycolytic metabolism in CD8 T cells. CD8+ T cells were purified from naïve WT mouse spleens and cultured in anti-CD3/CD28-coated plates in the presence of IL-33 and rapamycin (25 nM). (a) The expression of Glut1 was analysed by flow cytometry and (b) the mean fluorescent intensity (MFI) of Glut1. (c) Transcript levels of glycolytic pathway associated genes in CD8+ T cells. (d) Schematic figure of IL-33-regulated glycolytic metabolism through the mTORC1 signalling pathway. The data are shown as mean ± SEM from single experiments and are representative of at least three experiments performed. Triplicates were performed for each group. One-way ANOVA with Dunnett multiple comparisons were used for statistical analysis of three or more groups. *p < 0·05; **p < 0·01; ***p < 0·001; ****p < 0·0001
