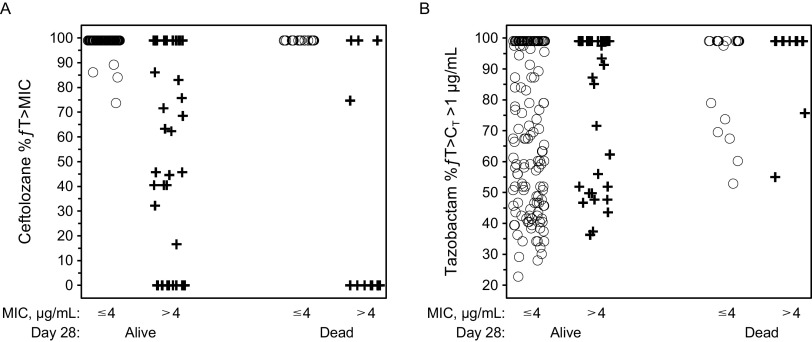
FIG 1.
Scatterplots of 28-day all-cause mortality stratified by baseline MIC category (≤4, >4 μg/mL) for (A) ceftolozane (%ƒT>MIC) and (B) tazobactam (%ƒ>CT >1 μg/mL). %ƒT>MIC, percentage of time the concentration of free ceftolozane in plasma exceeded the MIC; %ƒ>CT >1 μg/mL, percentage of time the concentration of free tazobactam in plasma exceeded the threshold concentration of 1 μg/mL.

