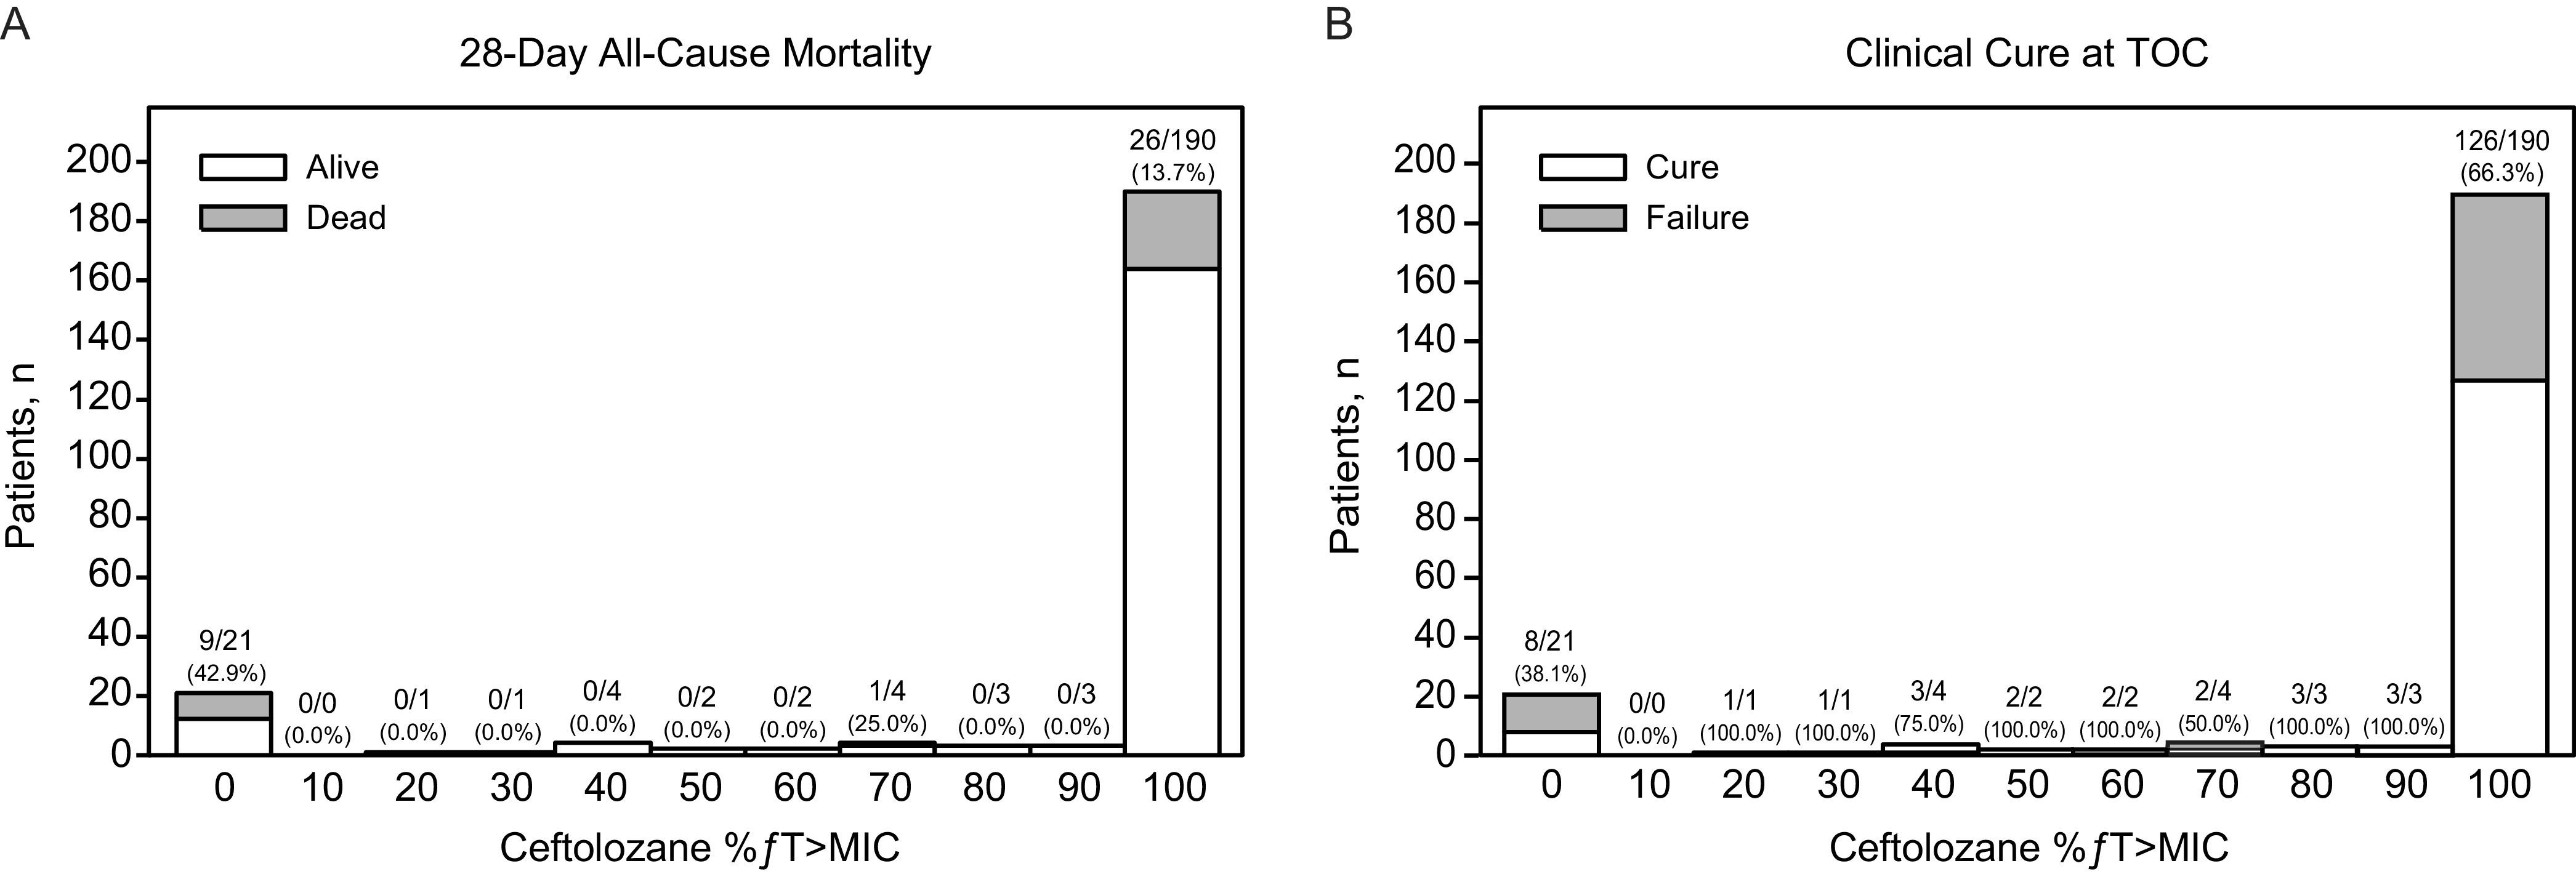
FIG 3.

Frequency distributions of exposure measures for ceftolozane (%ƒT>MIC) by (A) 28-day all-cause mortality and by (B) clinical cure at TOC. The number under each bar along the x axis represents the median of the range of values for that bar. The ratio of numbers represents the number of deaths/total number of participants in each bar. The number in parentheses is the percentage of participants who died. %ƒT>MIC, percentage of time the concentration of free ceftolozane in plasma exceeded the MIC; TOC, test of cure.
