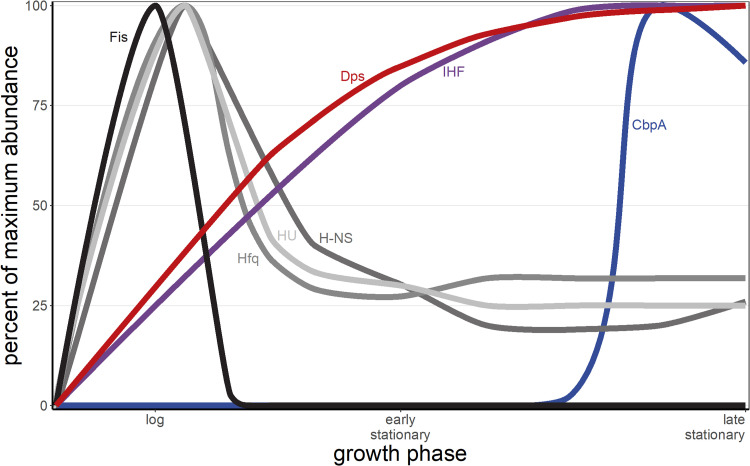
FIG 5.
Major E. coli NAP abundance by growth phase. NAPs are differentially expressed during different growth phases. Dps (red) and IHF (purple) protein abundances are low during log phase and high during stationary phase; Fis (black), H-NS (dark gray), HU (light gray), and Hfq (medium gray) are highly expressed during log phase and lowly expressed during stationary phase; and CbpA (blue) is lowly expressed until mid- to late stationary phase. The x axis is not linear with time. (Data inspired by Ali Azam et al. [19].)

