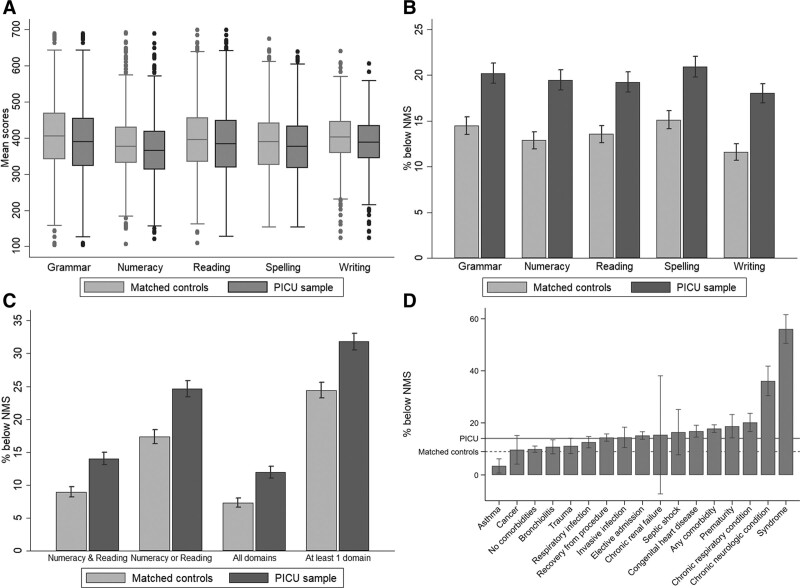
Figure 1.
Educational outcomes assessed through the Year 3 National Assessment Program—Literacy and Numeracy (NAPLAN) in 5,017 children who survived PICU admission before their fifth birthday are shown comparing PICU survivors and matched controls. A, Box-whisker plots comparing Year 3 NAPLAN scores between PICU survivors and controls for each of the five NAPLAN domains. B, Proportion of students failing to meet the National Minimal Standard (NMS) during Year 3 NAPLAN testing between cases and controls for each of the five NAPLAN domains. C, Proportion of students failing to meet the NMS during Year 3 NAPLAN testing between cases and controls for both reading and numeracy, either reading and numeracy, all NAPLAN domains, or at least one NAPLAN domain. D, Proportion of students failing to meet the NMS during Year 3 NAPLAN is shown in ascending order for different diagnostic groups in comparing with the average outcomes of PICU survivors (straight horizontal line) and in relation to matched controls (dashed horizontal line). Error bars represent 95% CIs.

