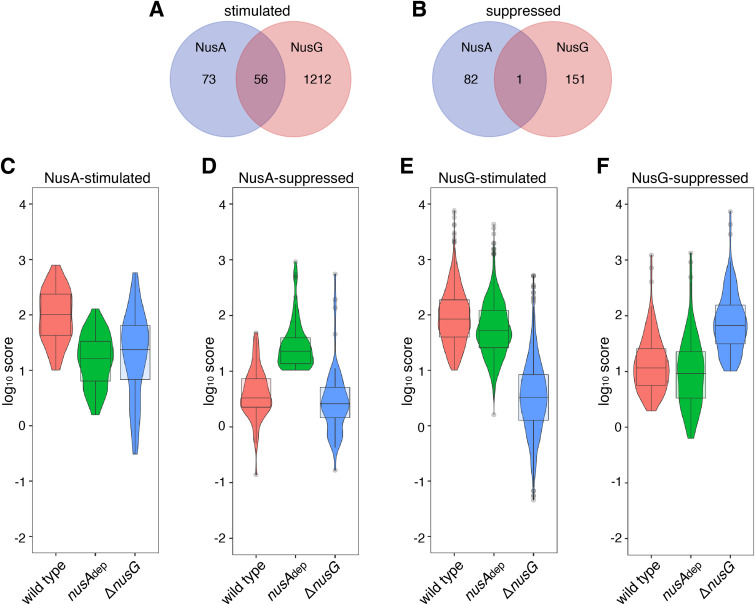
FIG 4.
Effects of NusG on NusA-stimulated and NusA-suppressed pauses. (A and B) Venn diagrams depicting the number and overlap of pause peaks that are classified as factor dependent. (A) Pauses that are stimulated (log2FC score of ≤−2) by NusA (blue), NusG (red), or both (magenta). (B) Pauses that are suppressed (log2FC score of ≥2) by NusA (blue), NusG (red), or both (magenta). (C to F) Violin plots overlaid with box plots showing the distribution of pause strength in wild-type (WT), nusAdep, and ΔnusG strains for NusA-stimulated (C), NusA-suppressed (D), NusG-stimulated (E), and NusG-suppressed (F) pauses identified in vivo. Boundaries of the box designate the interquartile range (IQR), while upper/lower whiskers extend from the 75th/25th percentile to the largest/smallest value, respectively, no further than 1.5 × IQR in either direction. All pairwise P values are in Data Set S2.

