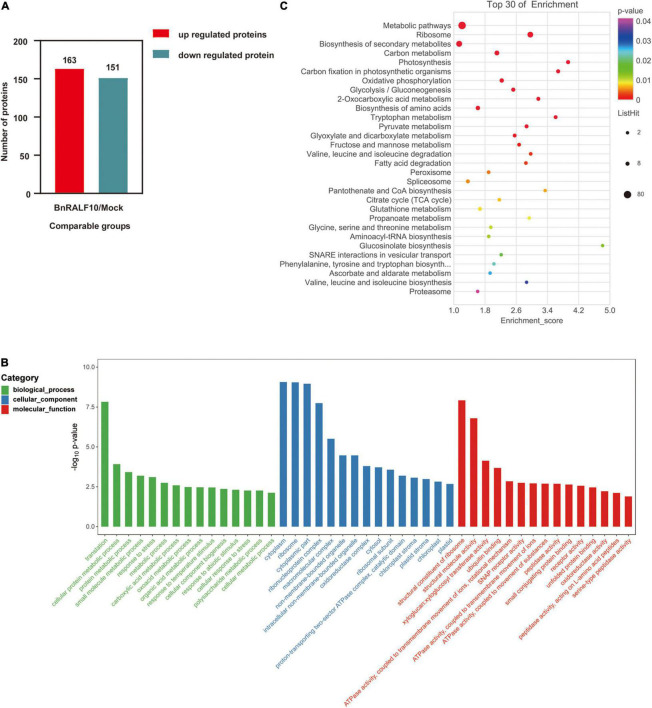
FIGURE 9.
Functional categorization of proteins differentially expressed between oilseed rape leaves infiltrated with 1 μM BnRALF10 and ddH2O. The expression trend (A), GO and KEGG analyses of differentially expressed proteins (B,C) (p < 0.05 and fold change >2 or <2) were presented. Leaves of 4-week-old oilseed rape plants were sampled at 4 h after infiltration with ddH2O and 1 μM BnRALF10, respectively. The bubble size represents the number of proteins, and the bubble color means the p-value of the significance. The pathway enrichment statistical analysis was performed by Fisher’s exact test. Thirty pathways showing the lowest p-value were selected for this analysis.

