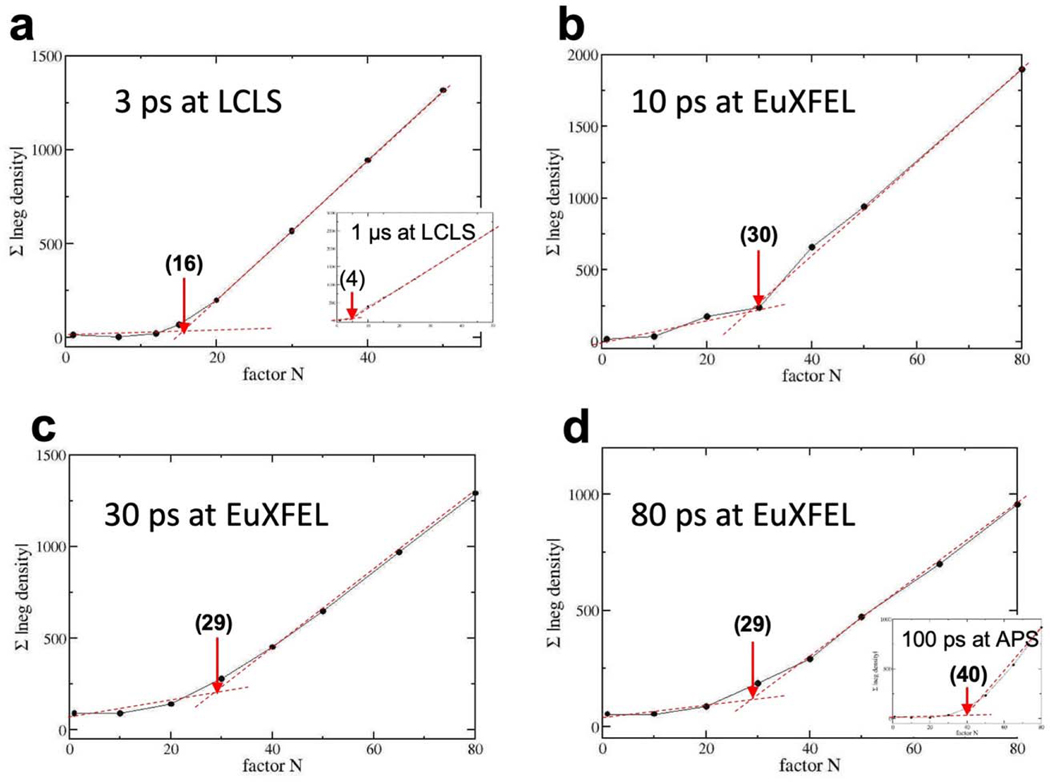
Extended Figure 7. Method to determine the factor N and the population transfer (PT).
The factor N has been determined to calculate extrapolated, conventional maps from data collected at various X-ray sources. Black spheres: summed absolute negative DED in a sphere of R = 4 Å centered on the PCA chromophore double bond. Red dotted lines: the more horizontal line follows the initial slope of the data; the second line delineates the constant incline with larger Ns. The Next (in brackets) can be estimated from the intersection of the two lines. a, 3ps data from CXI at LCLS collected with fs laser excitation in the absorption maximum (Pande et al., 2016). Factor N = 16, PT = 12.5 %, insert: 1 μs data collected with ns laser excitation. N = 4, and PT = 50% (Tenboer et al., 2014). b, c, and d, Factors N for the 10 ps, 30 ps, and 80 ps data collected at the EXFEL with fs laser excitation outside the absorption maximum. PT is about 7 % throughout. Insert in d, 100 ps data collected at APS (about 6% PT, Jung et al., 2013). 13,214, 13,542, 13,722, 13,142, 13,014 and 12,889 observed difference amplitudes are used to determine extrapolated maps for the 100ps, 1μs, 3ps, 10ps, 30ps and 80ps time delays, respectively.

