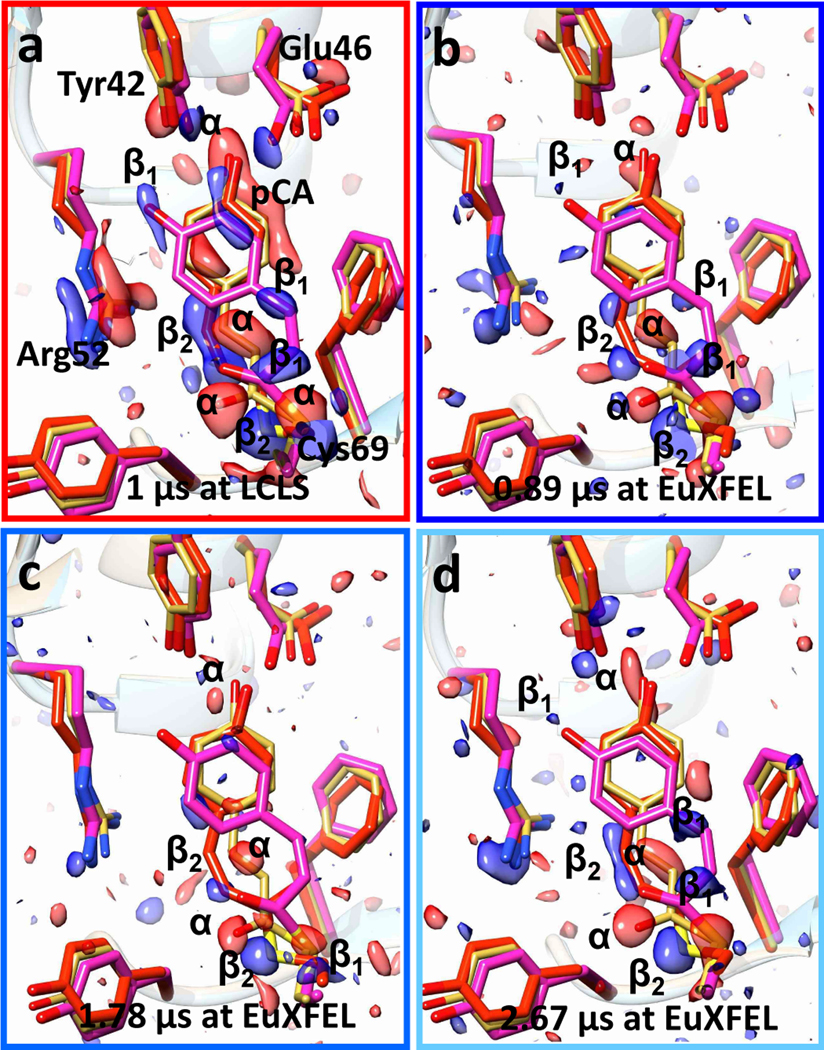
Fig. 3|. TR-SFX experiments at LCLS and EuXFEL.

a, Difference electron density (DED) in the PYP chromophore pocket at 1 μs time-delay as determined at the LCLS (Tenboer et al., 2014). Red: negative DED, blue: positive DED on the −3σ/3σ contour levels, respectively. Prominent features are labeled α (negative) or β1 and β2 (positive). Features α are on top of the reference structure (yellow), β1 and β2 features correspond to intermediate structures called pR1 (magenta) and pR2 (red), respectively. The pattern of α and β1, β2 features persists in all maps at all times. b – d, Results of the control experiment with 1.13 MHz X-ray pulse repetition and 376 kHz laser excitation (see also Fig. S2b). b, 0.89 μs after the laser pulse, c, 1.78 μs after the laser pulse, d, 2.67 μs after the laser pulse.
