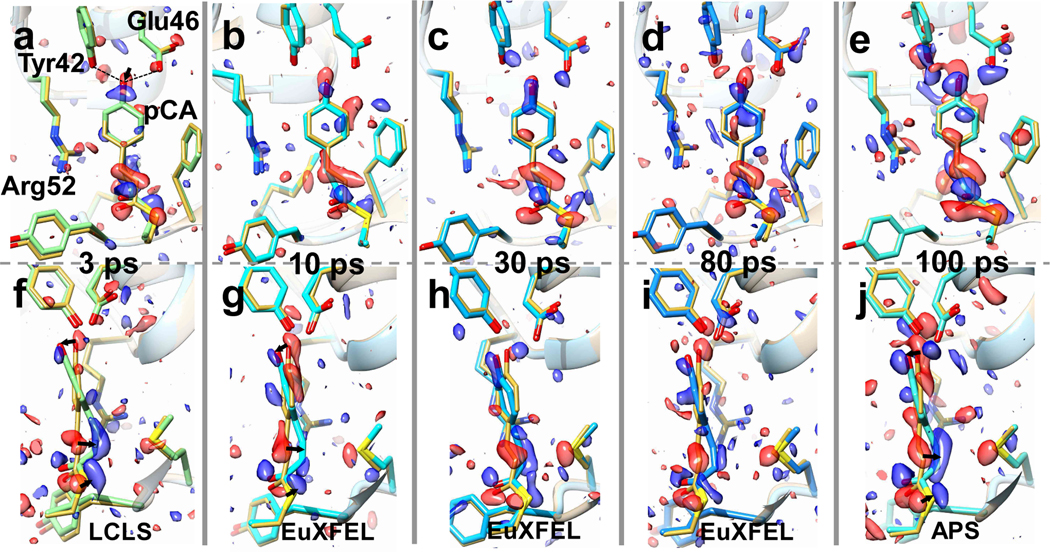
Fig. 5|. Time series of TRX data from 3 ps to 100 ps collected at LCLS, EuXFEL and APS.
Structures and difference electron density (DED) in the chromophore binding region of PYP. Red: negative DED (−3σ contour level), blue positive DED (3 σ contour level). Important residues and the pCA chromophore are marked in a. Yellow structure: structure of the (dark) reference state. Arrows depict structural displacements in a, f and j. Upper: front view, lower side view. a and f, 3 ps delay as collected at LCLS. Green: PYP structure at 3 ps (Pande et al., 2016). b and g, 10 ps time delay, this study, cyan: PYP structure at 10 ps. c and h, 30 ps time delay, this study, sky blue: PYP structure at 30 ps. d and i, 80 ps time delay, this study, blue: PYP structure at 80 ps. e and j, 100 ps time-delay as determined at APS, light blue: PYP structure at 100 ps (Jung et al., 2012).

