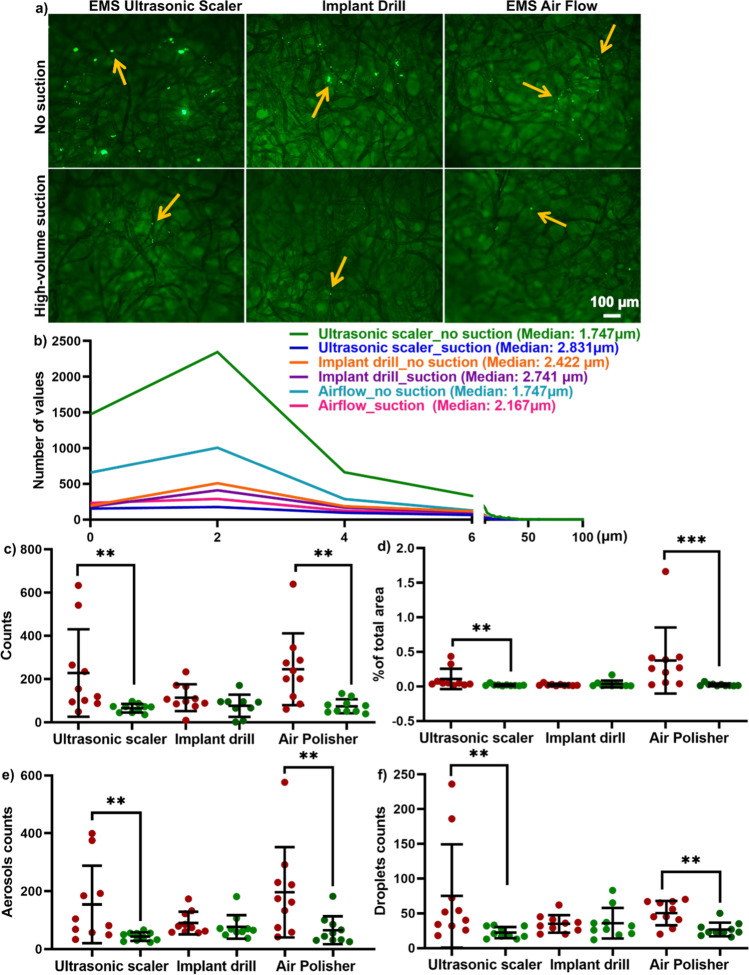
Fig. 4.
Representative images (a), histogram (b), and quantifications (c–f) of aerosol and droplet spread at 1.2 m away from the source. a The application of HVS significantly reduced the aerosol and droplet particles that were retained on the filter paper fiber at 1.2 m away from the source. Yellow arrows indicate fluorescein-stained particles on filter paper fibers. b The histogram of aerosol and droplets particles (ranging from 0.7 to 100 μm) was detected at 1.2 m away from the source. The median size of aerosol/droplets was smaller than 3 μm and the use of HVS reduced aerosol/droplet particles for all three dental AGPs. c–d HVS significantly reduced the number of mixed aerosols/droplets by counts per image (c) or as a percentage of the total area (d) of each filter paper. e, f When the data were separated into aerosols (e; ≤ 5 μm) and droplets (f; > 5 μm), the HVS significantly decreased the aerosol (e), and droplets (f) particles for ultrasonic scaler and air polisher. Data in c–f are displayed as mean values ± SD. **p < 0.0002; ***p < 0.0002 between with and without HVS

