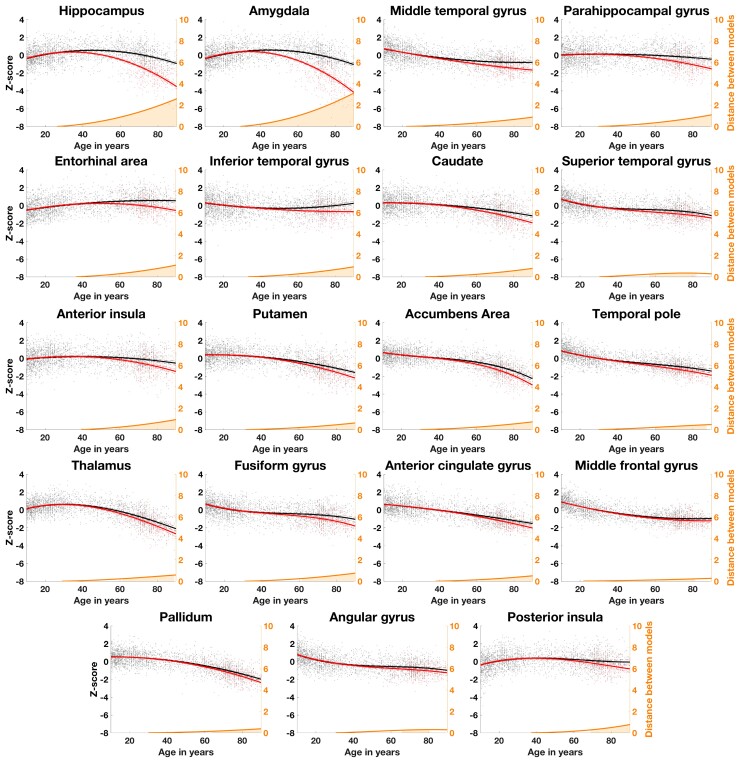
Figure 2.
Lifespan trajectories based on z-scores of normalized brain volumes for healthy ageing subjects (black line) and Alzheimer’s disease patients (red line). Black dots represent all healthy individuals and red dots Alzheimer’s disease patients. The prediction bounds of the models are estimated with a confidence level at 95%. The orange curve represents the distance between the healthy and pathological models. The orange area indicates the time period where the confidence intervals of both models do not overlap. Only models detected as significantly different between healthy ageing and Alzheimer’s disease are presented in this figure (19 brain structures out of 61 tested using AssemblyNet).

