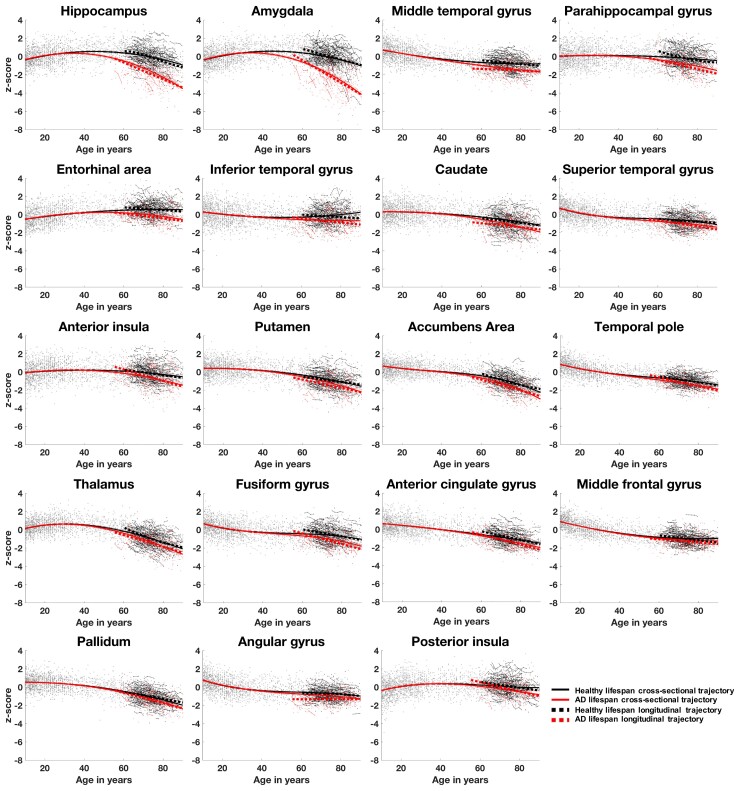
Figure 3.
Graphical comparison of cross-sectional (whole lines) and longitudinal (dotted lines) trajectories based on z-scores of normalized brain volumes for healthy ageing (black lines and dots) and Alzheimer’s disease patients (red lines and dots). Only the 19 structures detected as significantly different between healthy and pathological conditions are represented here. The average correlation coefficients for these 19 structures were 0.91 for Alzheimer’s disease models and 0.82 for healthy ageing models.

