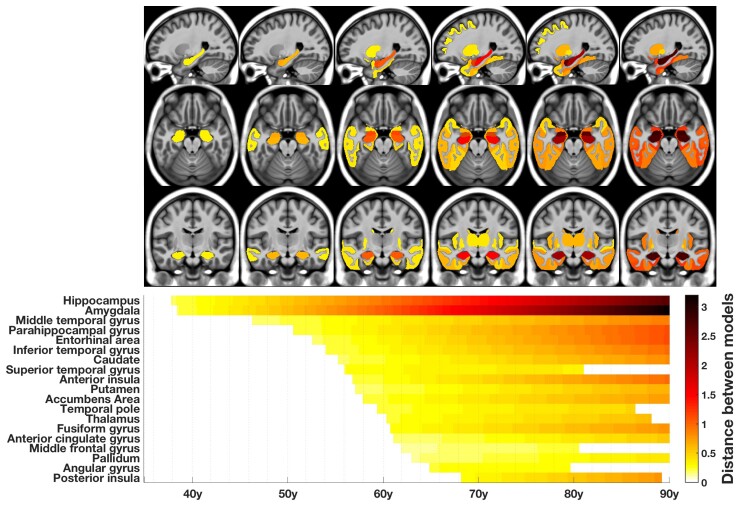
Figure 4.
The MRI staging scheme of structural progression of Alzheimer’s disease. The figure represents the chronological progression of distances between healthy and Alzheimer’s disease trajectories. The severity of structural divergence is colour-coded according to the bar at the bottom right of the figure.

