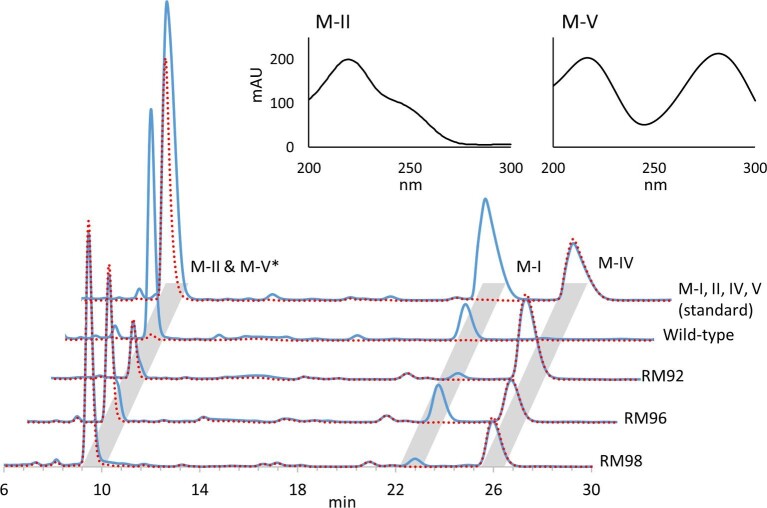
Fig. 2.
HPLC chromatograms of M-IV bioconversion with Escherichia coli expressing wild-type MycG and its mutants RM92, RM96, and RM98. The solid blue line represents the chromatograms at 220 nm. The dotted red lines indicate chromatograms at 280 nm. The upper panels show the UV spectrograms of M-II and M-V (1 mM). *The retention times of M-II and M-V are almost the same, and the peaks overlap. The absorption maximum for M-II occurs at 220 nm, while that of M-V is at 220 and 280 nm (upper panels). At same concentrations, M-II and M-V have equal peak areas at 220 nm. In addition, M-V has same peak areas at 220 and 280 nm. Therefore, M-V can be detected with a chromatogram at 280 nm, and M-II can be detected by subtracting the chromatogram at 280 nm from that at 220 nm.

