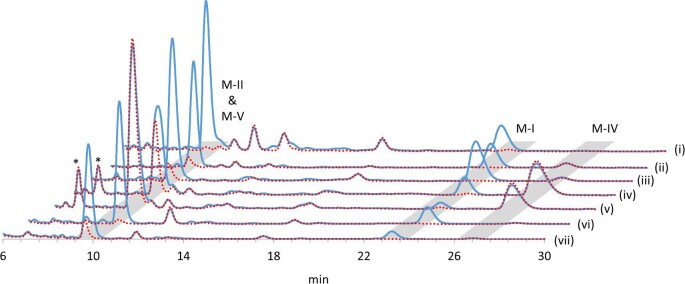
Fig. 4.
HPLC chromatograms of culture extracts obtained from Micromonospora griseorubida A11725 (i), TPMA0047 (ii, reconstitution of MycG wild-type), TPMA0073 (iii, reconstitution of MycG mutant R111Q/V358L), TPMA0074 (iv, reconstitution of MycG mutant W44R), TPMA0075 (v, reconstitution of MycG mutant V135G/E355K), TPMA0076 (vi, reconstitution of MycG mutant V135G), and TPMA0077 (vii, reconstitution of MycG mutant E355K). The solid blue line represents the chromatograms at 220 nm. The dotted red lines indicate chromatograms at 280 nm. The analysis conditions were the same as those shown in Fig. 2. *Peaks showing absorption maxima at 220 and 280 nm were detected in the culture extracts derived from TPMA0074 and TPMA0075. The results of liquid chromatography-mass spectrometry for these peaks were consistent with those of mycinamicin M-VI (Anzai et al., 2012). As this compound is a mycinamicin biosynthetic intermediate generated in the upper process of the biosynthetic step involving MycG, it was assumed to be unrelated to the action of MycG mutants.

