Figure 1:
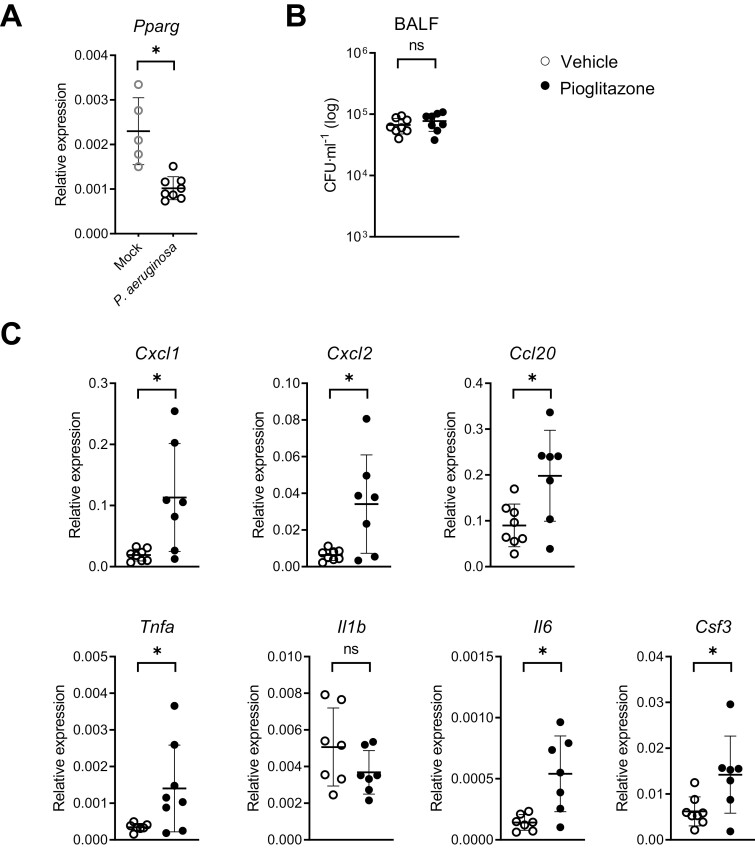
(A) Relative mRNA expression for Pparg analyzed by RT-PCR in lung epithelial brushes 6 h after P. aeruginosa infection or PBS administration (mock) via the airways. (B) Bacterial loads in BALF in vehicle and pioglitazone treated mice 6 h following induction of pneumonia. (C) Relative mRNA expression for the indicated immune-mediators analyzed by RT-PCR in lung epithelial brushes of mice 6 h after P. aeruginosa infection pre-treated with pioglitazone or vehicle. Graphs show mean and SD, and every dot represents one individual mouse. P values were calculated using Welch’s t-test. ∗P < 0.05, ns (not significant).

