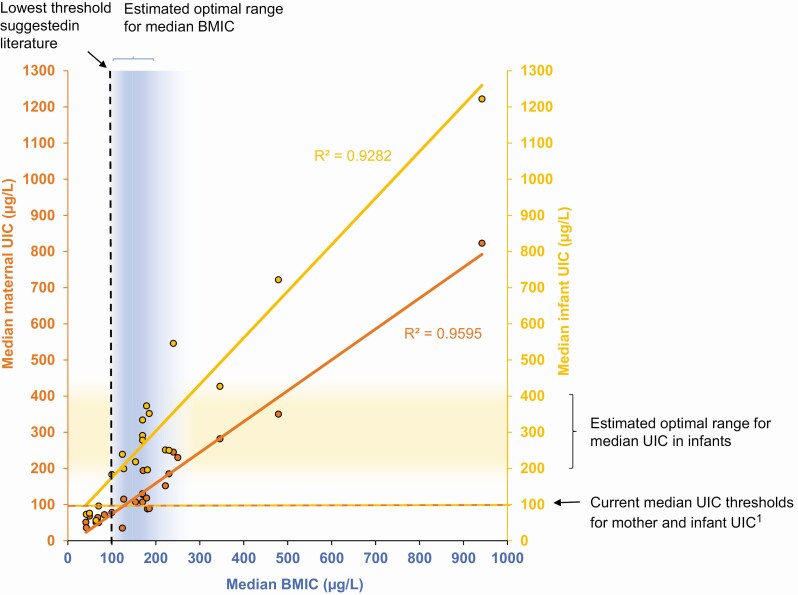
Figure 3.
Association between BMIC (blue) and maternal UIC (orange) and/or infant UIC (yellow) from cross-sectional studies conducted in lactating mothers and their breastfed infants. Data points show median BMIC, median maternal UIC, and median infant UIC obtained in mother-infant pairs (sample size, n = 52-739) (112, 145, 146, 166, 167, 203, 204, 211, 246-258). The dashed lines indicate current thresholds for the median BMIC and median UIC above which the iodine intake is considered adequate (21). The shaded areas indicate suggested optimal range for median BMIC and infant UIC based on current evidence presented in this review. The R2 values were calculated based on the published data. 1(21). BMIC, breast milk iodine concentration; UIC, urinary iodine concentration.

