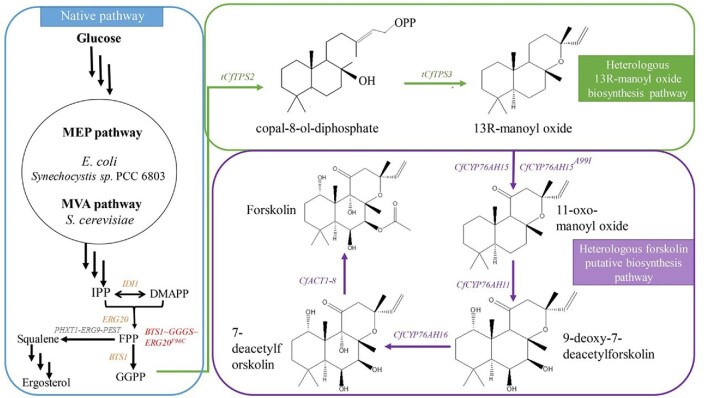
Fig. 3.
Schematic overview of the 13R-MO and forskolin biosynthesis pathway. Native pathway genes are marked in orange, the Bts1p and Erg20F96Cp fusion protein is indicated in red, ERG9 was downregulated as shown in gray, heterologous 13R-MO biosynthesis genes are marked in green, and heterologous forskolin putative biosynthesis genes are marked in purple.

