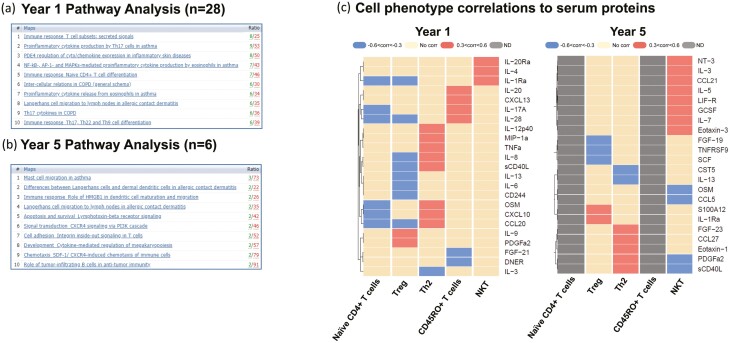
Fig. 5.
Pathway analysis. (a) Top 10 pathway maps for highly expressed proteins at year 1 that decrease expression by year 5. The 28 specific proteins used for this analysis are outlined in Fig. 3a. (b) Top 10 pathways of most highly expressed proteins at year 5 that were low or absent at year 1. The six specific proteins used for this analysis are outlined in Fig. 3a. (c) Heat map correlations of cell phenotypes previously assessed by flow cytometry [12] to serum protein analysis from same time point.

