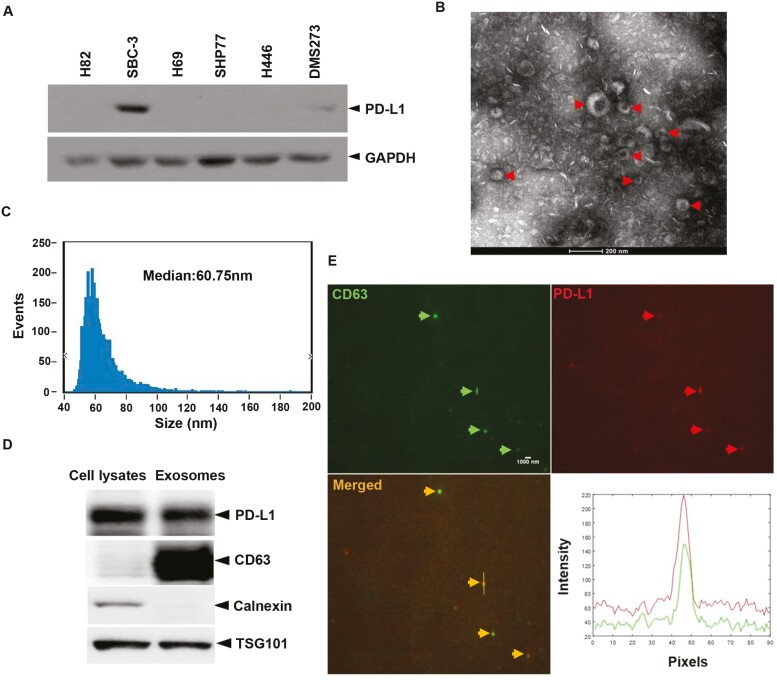
Figure 1:
SCLC tumor cells release EVs expressing membrane PD-L1. (A) Western blot analysis of the expression of PD-L1 in multiple lung cancer cells. (B) A representative TEM image of purified SBC-3 cells EVs. Red arrows point to EVs. (C) Size distribution of SBC-3-derived EVs, as analyzed by nFCM. (D) Western blot of PD-L1 in EVs isolated from the media of SBC-3 and SBC-3 cells. CD63 and TSG101, the markers of EVs. Calnexin, the negative marker of EVs. (E) Representative confocal immunofluorescence microscope image showing expression levels of CD63 (EVs marker, displaying with green fluorescence) and PD-L1 (displaying with red fluorescence) on the surface of single EV isolated from SBC-3 cells. Arrows point to EVs.

