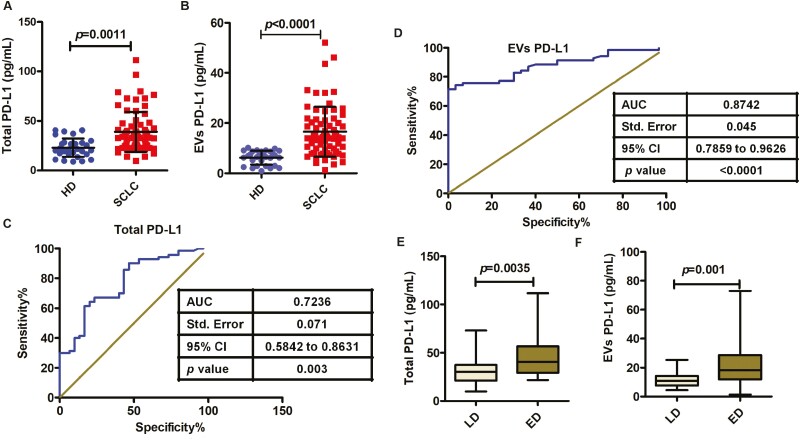
Figure 4:
Association of total PD-L1 or EVs PD-L1 levels with clinicopathological data in SCLC. (A) Total PD-L1 is elevated in SCLC patients (n = 70) compared with healthy donor (n = 30) (P = 0.0011). (B) PD-L1+ EV is significantly higher in SCLC patients (n = 70; P < 0.0001). (C and D) ROC curve analysis for the indicated parameters in patients with SCLC compared to healthy donors. (E) Protein concentrations of total PD-L1 show a significant difference in patients with extensive disease (ED) relative to those with limited disease (LD) (P = 0.0035). (F) PD-L1+ EVs are significantly elevated in ED patients compared with LD patients (P = 0.001). Data represent mean ± SD. Statistical analyses were performed using a two-sided unpaired t-test.

