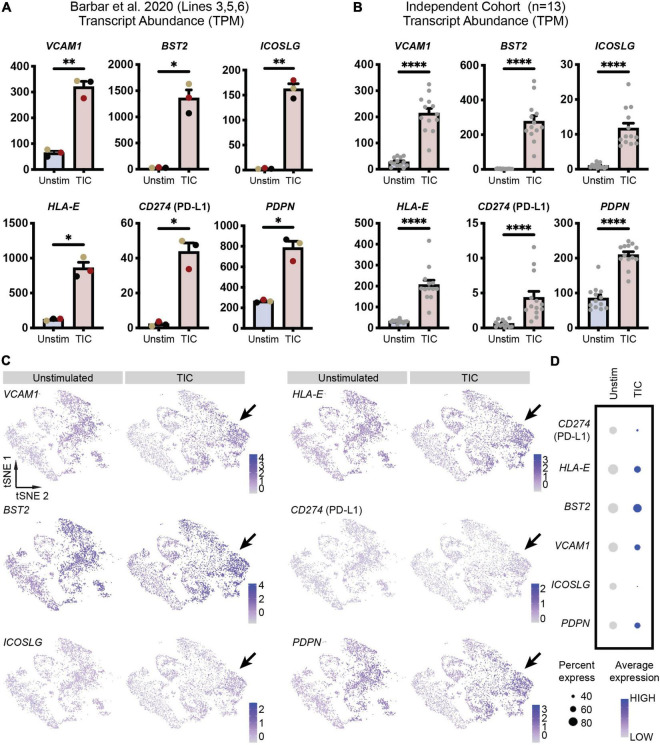
FIGURE 3.
Novel reactive astrocyte markers are upregulated at the transcriptional level. (A) Transcript abundances in transcripts per million (TPM) for each of the six genes are plotted to visualize marker expression levels for each individual line (n = 3, line 3 = black, line 5 = yellow, line 6 = red from Barbar et al., 2020a). Individual dots are means of three technical replicates for each line; error bars represent standard error of means. p-value was calculated using a two-tailed Welch’s t-test. *, p-value < 0.05; **, p-value < 0.01. (B) Transcript abundances (in TPM) for each of the six genes are plotted to visualize marker expression in hiPSC-derived astrocytes from an independent cohort of 13 lines (individual replicates shown as dots). Error bars represent standard error of means. P-value was calculated using a Wald test through DESeq2 and adjusted for multiple comparisons using the Benjamini and Hochberg method. ****, p-value < 0.0001. (C) Feature plots of CD49f+ hiPSC-derived astrocyte scRNA-seq (Barbar et al., 2020a) demonstrates increased expression of each marker’s associated gene in TIC-induced reactive astrocytes compared to unstimulated astrocytes. Arrows highlight clusters most associated with TIC-stimulation and having the greatest upregulation of putative reactive astrocyte markers. (D) Dot plot showing genes enriched in TIC-induced reactive astrocytes and unstimulated astrocytes. Each row is an individual marker gene.

