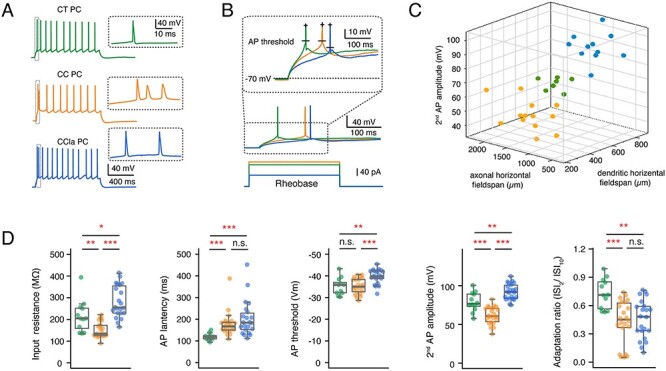
Figure 2.

Comparison of electrophysiological parameters in morphological subtypes of L6A PCs. (A) Representative firing patterns of a morphological identified CT (green) PC, a CC PC (orange), and a putative CCla PC (blue); Inset, the initial part of the AP train at higher magnification. (B) First elicited AP (middle) of a representative CT (green), CC (orange), and CCla (blue) PC in response to rheobase current injection (bottom). Higher magnification of the first APs (inset) illustrating the difference in AP threshold and latency. (C) 3D scatter plot shows a clear separation of three L6A PC subtypes using morphological and electrophysiological properties. CT PCs in green, CC PCs in orange, and CCla PCs in blue. (D) Summary data of several electrophysiological properties of L6A CT (n = 15), CC (n = 23), and CCla (n = 22) PCs. Data were compared between groups and were presented as box plots as described in the Materials and Methods section, *P < 0.05, **P < 0.01, ***P < 0.001 for the Wilcoxon Mann–Whitney U test; n.s., not significant. The absolute P values are shown in Supplementary Table S1.
