Figure 3.

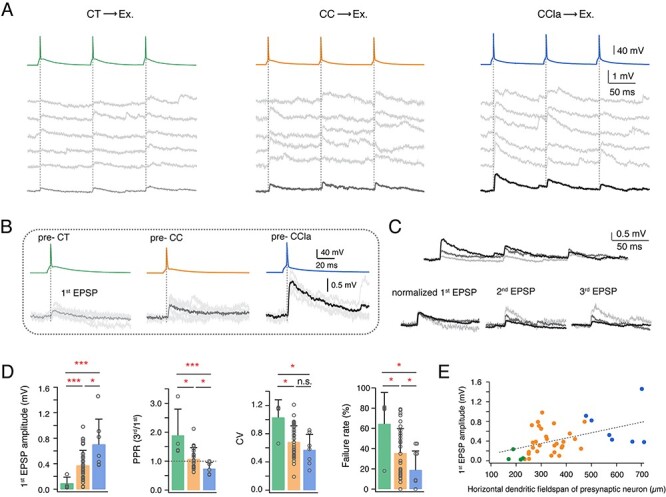
The properties of L6A E⟶E connections dependent on the different presynaptic PC subtypes. (A) Unitary synaptic connections in L6A with a presynaptic CT (left), CC (middle), and CCla (right) PC. Five consecutive EPSPs (middle) and the average EPSP (bottom) are elicited by a train of three presynaptic APs (top, 10 Hz). (B) First EPSP induced by AP of a presynaptic CT, CC, and CCla PC. The mean EPSP waveform is shown in light gray for pre-CT pair, in gray for pre-CC pair, and in dark gray for pre-CCla pair. (C) Top, overlay of average EPSPs recorded in a monosynaptic connection with a presynaptic CT (light gray), CC (gray), and CCla PC (dark gray). Bottom, normalizing the mean EPSP amplitudes reveals the difference in PPR for these three connection types. (D) Summary data of several synaptic properties of L6A E⟶E connections with presynaptic CT (green, n = 4), CC (orange, n = 36), and CCla (blue, n = 7) PCs. Data were compared between groups and presented as the mean + SD, *P < 0.05, ***P < 0.001 for the Wilcoxon Mann–Whitney U test; n.s., not significant. (E) Plot of first EPSP amplitude versus horizontal dendritic field-span of the presynaptic neuron in L6A E⟶E connections. Best linear fit is shown as gray dashed line (r = 0.47, P = 0.0014). Color coding as in (D).
