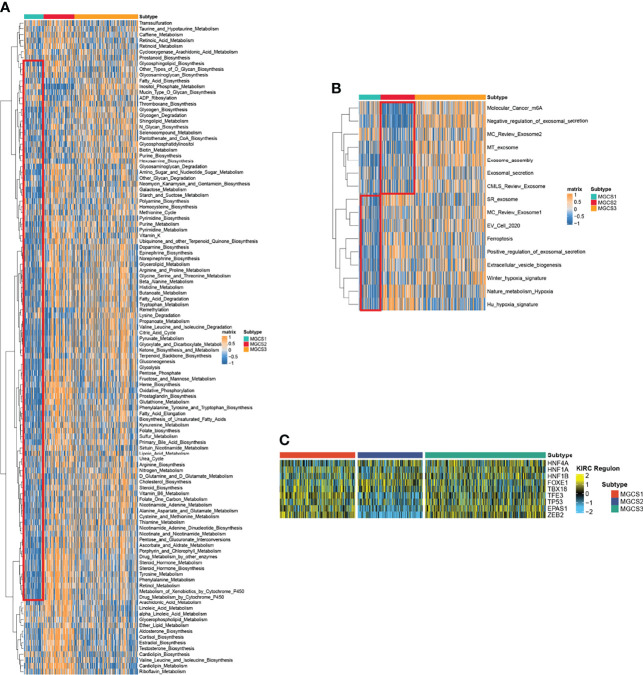
Figure 3.
Functional enrichment analysis of MGCS1, MGCS2 and MGCS3 subgroups. (A, B) Heatmap of metabolism-related and cancer-related pathway enrichment scores among the subtypes by GSVA analysis. Orange represented activated pathways and blue represented inhibited pathways. (C) Heatmap of transcription factor regulon activation in three m7G modification subtypes. Yellow represented transcription factor regulation-activation. Blue represented transcription factor regulation-inhibition.

