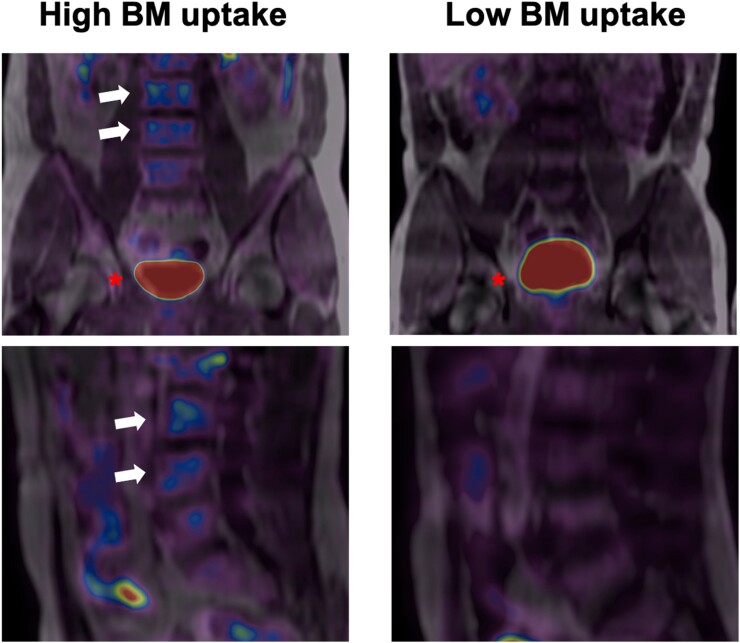
Figure 1.
Bone marrow uptake. Representative baseline 18F-fluorodeoxyglucose positron emission tomography/magnetic resonance imaging scans from participants. The left panel shows fused 18F-fluorodeoxyglucose positron emission tomography/magnetic resonance imaging in coronal (upper) and sagittal (lower) views. L3 and L4 vertebrae (white arrows) present high 18F-fluorodeoxyglucose uptake (visualized in blue). The right panel shows the same coronal and sagittal views; 18F-fluorodeoxyglucose uptake is not visualized. The bladder is visualized in red in both upper panels (red asterisk).

