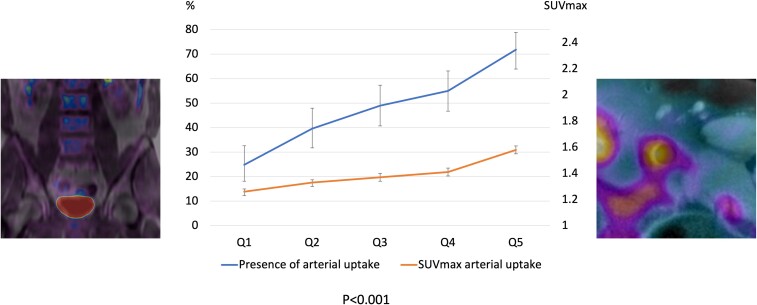
Figure 5.
Relationship between bone marrow and vascular 18F-fluorodeoxyglucose uptake. The left and right panels show representative positron emission tomography/magnetic resonance imaging analysis of 18F-fluorodeoxyglucose uptake in lumbar vertebrae and vascular tissue, respectively. The chart shows increases in the presence of vascular uptake (left Y-axis) and in vascular-uptake SUVmax (right Y-axis) with increasing bone marrow uptake quintile.

