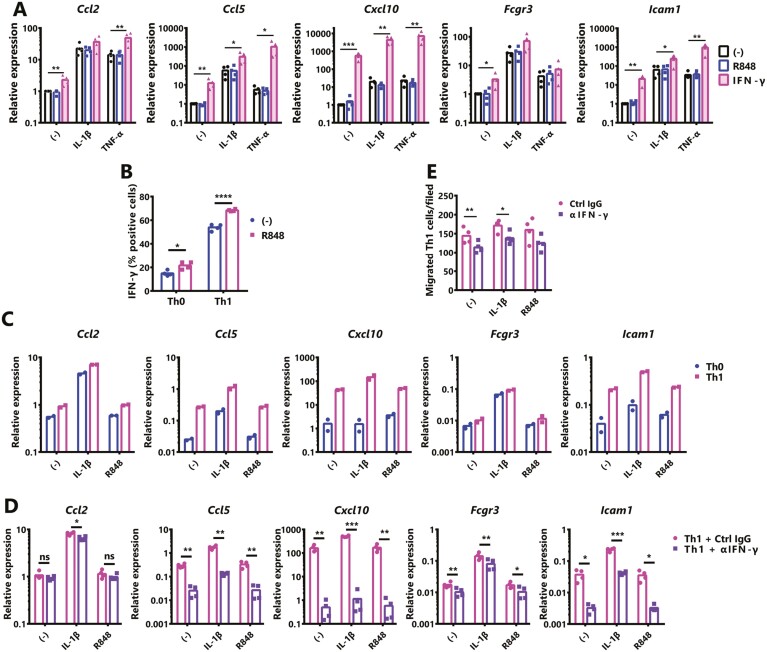
Figure 3.
Enhancement of the inflammatory response in renal mesangial cells by Th1-derived IFN-γ. (A) Primary normal mouse mesangial cells were exposed to IL-1β (10 ng/ml), TNF-α (10 ng/ml), IFN-γ (50 ng/ml) and IL-1β+IFN-γ, TNF-α+IFN-γ with or without TLR7 agonist R848 (1 μg/ml) for 24 h. The expression of indicated genes was examined by qPCR. (B) Percentages of intracellular IFN-γ production from polarized Th1 cells in the presence or absence of R848 (1 μg/ml), assessed after 5 h of restimulation with phorbol 12-myristate 13-acetate (10 ng/ml) + ionomycin (1 μg/ml). (C) Mesangial cells were co-cultured with a T-cell receptor (TCR)-stimulated Th0 or Th1 cells using a Transwell system (0.4-μm pore). Cells were treated with IL-1β or R848 for 24 h. The expression of indicated genes was examined by qPCR. Assays were performed in duplicate. (D, E) Mesangial cells were co-cultured with TCR-stimulated Th1 cells using a cell culture insert ((D); 0.4-μm pore Millicell, or (E); 3-μm pore Transwell). Cells were treated with IL-1β or R848 and exposed to control IgG (Ctrl) or anti-IFN-γ Ab (αIFN-γ; 10 μg/ml) for 24 h. (D) Mesangial cells were subjected to qPCR. (E) Th1 cells that migrated to the bottom chamber were counted. Values represent the means, and each dot represents an individual experiment (N = 2 or 4). A one-way ANOVA followed by Dunnett’s multiple-comparison test (A), a two-tailed unpaired Student’s t-test (B), or paired Student’s t-test (D, E) was used to analyze the results. Asterisks indicate statistically significant differences (∗P < 0.05, ∗∗P < 0.01, ∗∗∗P < 0.001, ∗∗∗∗P < 0.0001) (ns: not significant).

