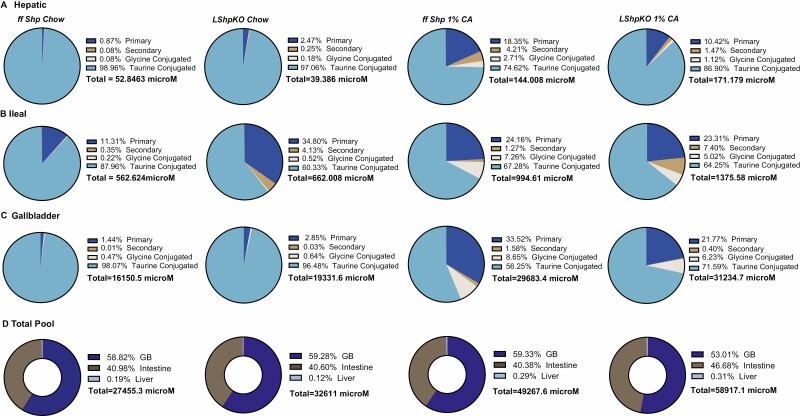
Figure 2.
Pie charts depicting (A) hepatic, (B) ileal, and (C) gallbladder bile acid composition in ff Shp and LShpKO mice on chow and 1% CA diets. Individual bile acid values were totalled and then categorized based on whether they were unconjugated primary, unconjugated secondary, glycine conjugated, or taurine conjugated. The sum of all the individual bile acid analytes in each tissue were then used to calculate the tissue-specific bile acid concentrations (D). Total concentrations and distribution of the bile acid pool shown in micromoles.

