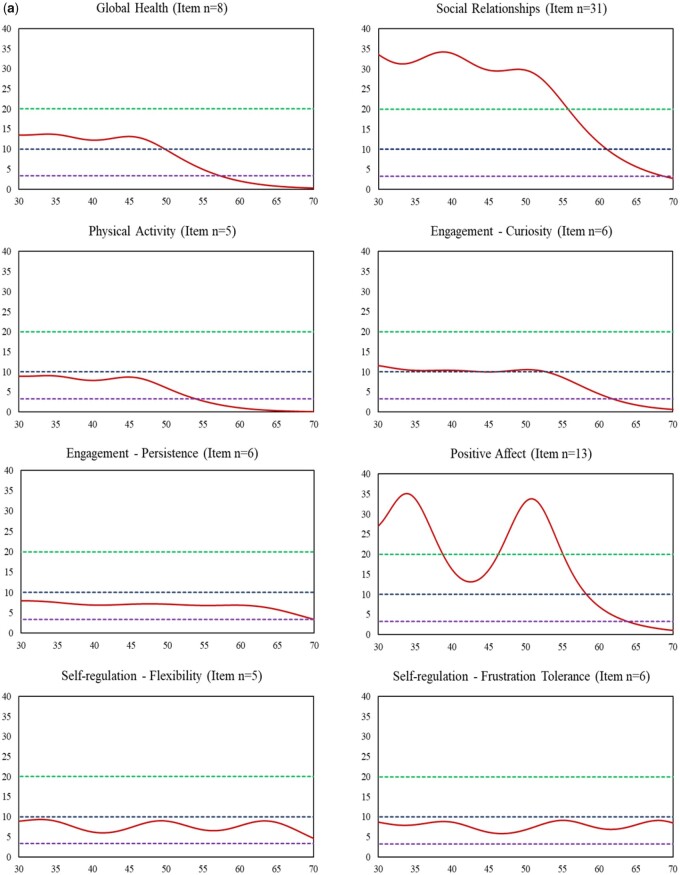
Figure 3.
Information function curve of each measure (red solid line). (a) Measures with Positive Direction: Higher Scores Represent Better Health (X-axis: T score; Y-axis: Information function). Note. X-axis represents T scores with mean = 50 and standard deviation = 10. Y-axis represents information function at the measure level. An information function of 3.3, 10, and 20 is corresponding to a reliability of 0.70 (green dashed line), 0.90 (navy blue dashed line), and 0.95 (purple dashed line), respectively. (b) Measures with negative direction: higher scores represent worse health (X-axis: T scores; Y-axis: information function). Note. X-axis represents T scores with mean = 50 and standard deviation = 10. Y-axis represents information function at the measure level. An information function of 3.3, 10, and 20 is corresponding to a reliability of 0.70 (green dashed line; the top line), 0.90 (navy blue dashed line; the middle line), and 0.95 (purple dashed line; the bottom line), respectively.

